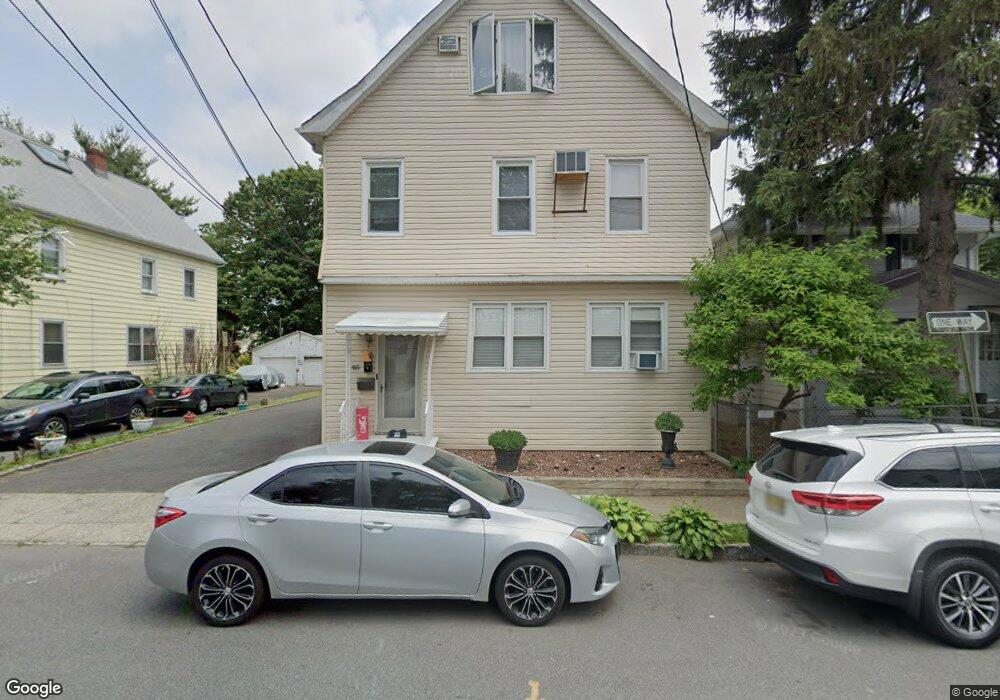
45 Mill St Bloomfield, NJ 07003
Estimated Value: $632,000 - $749,000
Studio
--
Bath
2,728
Sq Ft
$253/Sq Ft
Est. Value
About This Home
This home is located at 45 Mill St, Bloomfield, NJ 07003 and is currently estimated at $691,105, approximately $253 per square foot. 45 Mill St is a home located in Essex County with nearby schools including Demarest School, Bloomfield Middle School, and Bloomfield High School.
Ownership History
Date
Name
Owned For
Owner Type
Purchase Details
Closed on
Sep 10, 2014
Sold by
Mcfeeley James and Mcfeeley Olimpia
Bought by
Mcfeeley James and Mcfeeley Olimpia
Current Estimated Value
Purchase Details
Closed on
Jul 9, 2008
Sold by
Mcfeeley James A and Mcfeeley Olympia E
Bought by
Mcfeeley James and Mcfeeley Olimpia
Home Financials for this Owner
Home Financials are based on the most recent Mortgage that was taken out on this home.
Original Mortgage
$374,535
Interest Rate
6.47%
Mortgage Type
New Conventional
Purchase Details
Closed on
Jul 23, 2004
Sold by
Baldi Gerardo
Bought by
Mcfeeley James and Mcfeeley Olympia
Home Financials for this Owner
Home Financials are based on the most recent Mortgage that was taken out on this home.
Original Mortgage
$191,200
Interest Rate
6.33%
Create a Home Valuation Report for This Property
The Home Valuation Report is an in-depth analysis detailing your home's value as well as a comparison with similar homes in the area
Home Values in the Area
Average Home Value in this Area
Purchase History
| Date | Buyer | Sale Price | Title Company |
|---|---|---|---|
| Mcfeeley James | -- | -- | |
| Mcfeeley James | -- | -- | |
| Mcfeeley James | -- | First American Title Ins Co | |
| Mcfeeley James | $239,000 | -- |
Source: Public Records
Mortgage History
| Date | Status | Borrower | Loan Amount |
|---|---|---|---|
| Previous Owner | Mcfeeley James | $374,535 | |
| Previous Owner | Mcfeeley James | $191,200 |
Source: Public Records
Tax History
| Year | Tax Paid | Tax Assessment Tax Assessment Total Assessment is a certain percentage of the fair market value that is determined by local assessors to be the total taxable value of land and additions on the property. | Land | Improvement |
|---|---|---|---|---|
| 2025 | $13,438 | $411,200 | $139,600 | $271,600 |
| 2024 | $13,438 | $411,200 | $139,600 | $271,600 |
| 2022 | $13,167 | $411,200 | $139,600 | $271,600 |
| 2021 | $12,924 | $411,200 | $139,600 | $271,600 |
| 2020 | $12,727 | $411,200 | $139,600 | $271,600 |
| 2019 | $12,254 | $307,800 | $122,000 | $185,800 |
| 2018 | $12,201 | $307,800 | $122,000 | $185,800 |
| 2017 | $12,017 | $307,800 | $122,000 | $185,800 |
| 2016 | $11,881 | $307,800 | $122,000 | $185,800 |
| 2015 | $11,773 | $307,800 | $122,000 | $185,800 |
| 2014 | $11,558 | $307,800 | $122,000 | $185,800 |
Source: Public Records
Map
Nearby Homes
- 48 Broughton Ave
- 48 Broughton Ave Unit 2
- 54 Broughton Ave
- 106 Broughton Ave
- 290 Hoover Ave
- 290 Hoover Ave Unit 9
- 20 Elston St
- 348 Hoover Ave Unit 92
- 366 Hoover Ave Unit 119
- 378 Hoover Ave Unit 149
- 18 Birch St
- 237 E Passaic Ave
- 371 Essex Ave
- 381 Essex Ave
- 124 Essex Ave
- 18 Ketner St
- 10 E Passaic Ave
- 17 Glen Ridge Pkwy
- 70 Valentine Rd
- 129 Pake St
- 47 Mill St
- 41 Mill St
- 49 Mill St
- 39 Mill St Unit 2
- 53 Mill St
- 27 Mill St
- 42 Mill St Unit 50
- 52 Broughton Ave
- 50 Broughton Ave
- 50 Broughton Ave Unit 2
- 40 Mill St Unit 5
- 40 Mill St Unit 4
- 40 Mill St Unit 7
- 40 Mill St Unit 6
- 40 Mill St Unit 1
- 40 Mill St Unit 3
- 40 Mill St Unit 2
- 40 Mill St
- 38 Mill St
- 38 Mill St Unit 3
Your Personal Tour Guide
Ask me questions while you tour the home.