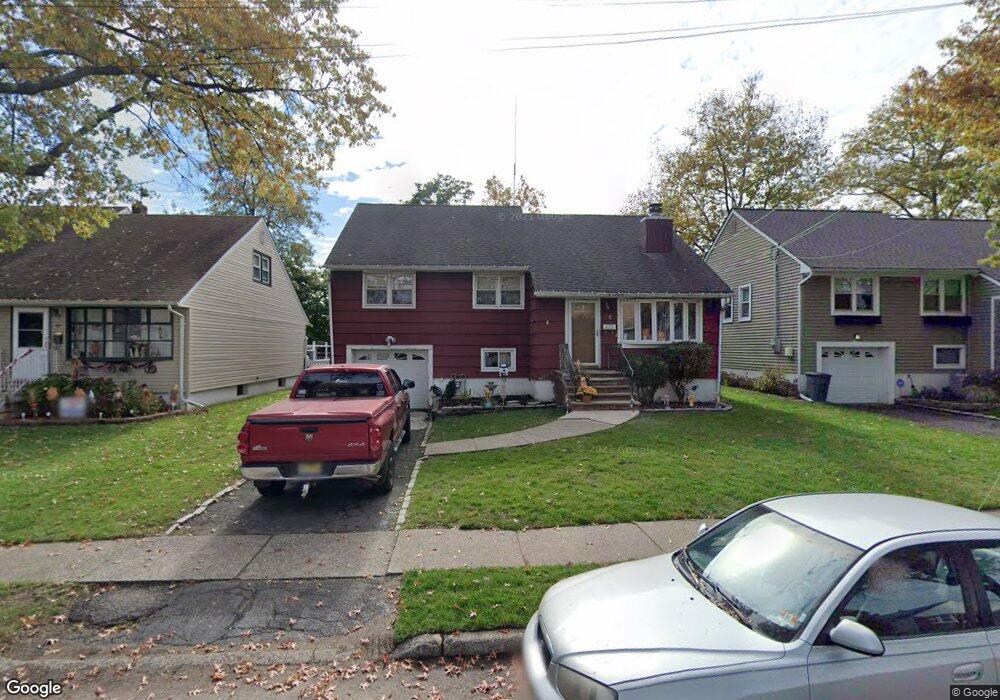
45 Morley Ln Bloomfield, NJ 07003
Estimated Value: $646,894 - $725,000
--
Bed
--
Bath
1,954
Sq Ft
$353/Sq Ft
Est. Value
About This Home
This home is located at 45 Morley Ln, Bloomfield, NJ 07003 and is currently estimated at $690,474, approximately $353 per square foot. 45 Morley Ln is a home located in Essex County with nearby schools including Brookdale School, Bloomfield Middle School, and Bloomfield High School.
Ownership History
Date
Name
Owned For
Owner Type
Purchase Details
Closed on
Mar 1, 1999
Sold by
Perillo Anthony
Bought by
Childers Greggy
Current Estimated Value
Home Financials for this Owner
Home Financials are based on the most recent Mortgage that was taken out on this home.
Original Mortgage
$165,645
Outstanding Balance
$40,021
Interest Rate
6.73%
Mortgage Type
FHA
Estimated Equity
$650,453
Purchase Details
Closed on
Jan 29, 1993
Sold by
Perillo Anthony S and Perillo Lisa M
Bought by
Perillo Anthony S and Perillo Lisa M
Purchase Details
Closed on
Apr 22, 1991
Sold by
Purcell Michael and Purcell Joanne
Bought by
Perillo Anthony and Perillo Cafone,Lisa
Purchase Details
Closed on
Aug 11, 1988
Sold by
Ferrate Joan
Bought by
Purcell Michael
Create a Home Valuation Report for This Property
The Home Valuation Report is an in-depth analysis detailing your home's value as well as a comparison with similar homes in the area
Home Values in the Area
Average Home Value in this Area
Purchase History
| Date | Buyer | Sale Price | Title Company |
|---|---|---|---|
| Childers Greggy | $190,000 | -- | |
| Perillo Anthony S | -- | -- | |
| Perillo Anthony | $165,000 | -- | |
| Purcell Michael | $150,000 | -- |
Source: Public Records
Mortgage History
| Date | Status | Borrower | Loan Amount |
|---|---|---|---|
| Open | Childers Greggy | $165,645 |
Source: Public Records
Tax History Compared to Growth
Tax History
| Year | Tax Paid | Tax Assessment Tax Assessment Total Assessment is a certain percentage of the fair market value that is determined by local assessors to be the total taxable value of land and additions on the property. | Land | Improvement |
|---|---|---|---|---|
| 2025 | $12,546 | $383,900 | $173,800 | $210,100 |
| 2024 | $12,546 | $383,900 | $173,800 | $210,100 |
| 2022 | $12,292 | $383,900 | $173,800 | $210,100 |
| 2021 | $12,066 | $383,900 | $173,800 | $210,100 |
| 2020 | $11,882 | $383,900 | $173,800 | $210,100 |
| 2019 | $13,631 | $342,400 | $157,000 | $185,400 |
| 2018 | $13,573 | $342,400 | $157,000 | $185,400 |
| 2017 | $13,367 | $342,400 | $157,000 | $185,400 |
| 2016 | $13,217 | $342,400 | $157,000 | $185,400 |
| 2015 | $13,097 | $342,400 | $157,000 | $185,400 |
| 2014 | $12,857 | $342,400 | $157,000 | $185,400 |
Source: Public Records
Map
Nearby Homes