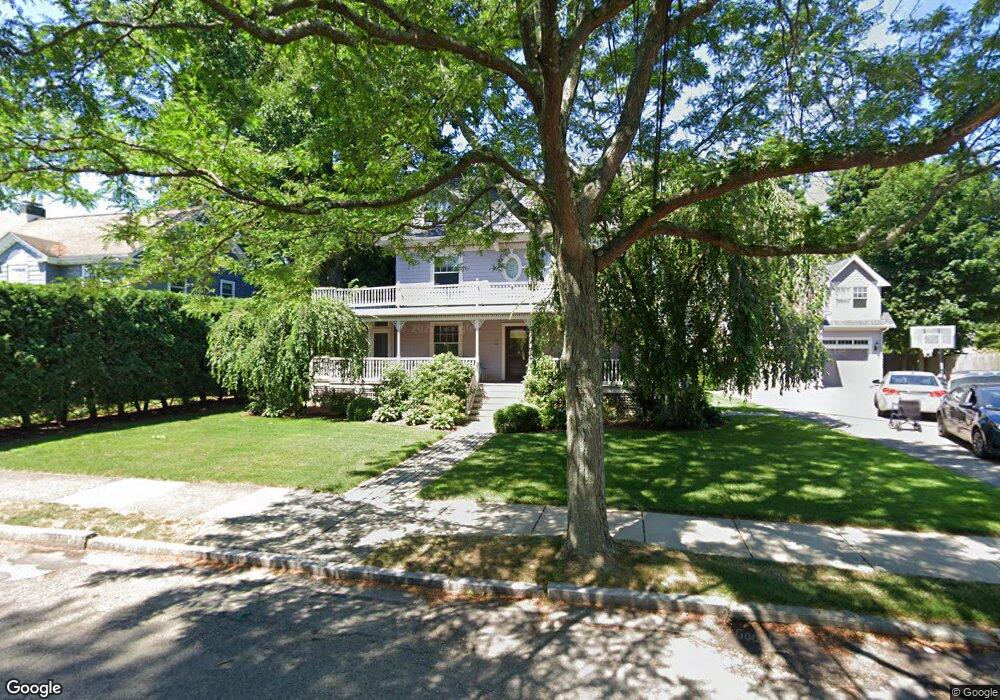
45 Morseland Ave Newton Center, MA 02459
Newton Centre NeighborhoodEstimated Value: $2,647,000 - $3,338,000
7
Beds
5
Baths
4,302
Sq Ft
$700/Sq Ft
Est. Value
About This Home
This home is located at 45 Morseland Ave, Newton Center, MA 02459 and is currently estimated at $3,013,116, approximately $700 per square foot. 45 Morseland Ave is a home located in Middlesex County with nearby schools including Mason Rice Elementary School, Charles E Brown Middle School, and Newton North High School.
Ownership History
Date
Name
Owned For
Owner Type
Purchase Details
Closed on
Apr 21, 2016
Sold by
Lynn S Abrams T
Bought by
Brian S Abrams T
Current Estimated Value
Purchase Details
Closed on
Oct 22, 2015
Sold by
Abrams Brian S and Abrams Lynn S
Bought by
Brian S Abrams T and Abrans Brian S
Purchase Details
Closed on
Jun 1, 2010
Sold by
Gazit Yuval and Miller Sheryl R
Bought by
Abrams Tr Brian S and Abrams Lynn S
Purchase Details
Closed on
Aug 5, 2008
Sold by
Tirabassi Mindi and Tirabassi Salvatore
Bought by
Miller Sheryl R and Gazit Yuval
Purchase Details
Closed on
May 1, 2007
Sold by
Relocation Prudential
Bought by
Tirabassi Mindi and Tirabassi Salvatore
Purchase Details
Closed on
Mar 2, 1993
Sold by
Yee Yu Hoke
Bought by
Plonski Joseph W and Roland-Plonski Lori
Create a Home Valuation Report for This Property
The Home Valuation Report is an in-depth analysis detailing your home's value as well as a comparison with similar homes in the area
Home Values in the Area
Average Home Value in this Area
Purchase History
| Date | Buyer | Sale Price | Title Company |
|---|---|---|---|
| Brian S Abrams T | -- | -- | |
| Brian S Abrams T | -- | -- | |
| Abrams Tr Brian S | $1,595,000 | -- | |
| Miller Sheryl R | $1,535,000 | -- | |
| Tirabassi Mindi | $1,350,000 | -- | |
| Relocation Prudential | $1,350,000 | -- | |
| Plonski Joseph W | $296,000 | -- |
Source: Public Records
Mortgage History
| Date | Status | Borrower | Loan Amount |
|---|---|---|---|
| Previous Owner | Plonski Joseph W | $465,750 | |
| Previous Owner | Plonski Joseph W | $523,750 |
Source: Public Records
Tax History Compared to Growth
Tax History
| Year | Tax Paid | Tax Assessment Tax Assessment Total Assessment is a certain percentage of the fair market value that is determined by local assessors to be the total taxable value of land and additions on the property. | Land | Improvement |
|---|---|---|---|---|
| 2025 | $28,419 | $2,899,900 | $1,389,700 | $1,510,200 |
| 2024 | $26,813 | $2,747,200 | $1,349,200 | $1,398,000 |
| 2023 | $25,813 | $2,535,700 | $1,051,200 | $1,484,500 |
| 2022 | $24,700 | $2,347,900 | $973,300 | $1,374,600 |
| 2021 | $23,522 | $2,186,100 | $918,200 | $1,267,900 |
| 2020 | $22,823 | $2,186,100 | $918,200 | $1,267,900 |
| 2019 | $22,179 | $2,122,400 | $891,500 | $1,230,900 |
| 2018 | $21,491 | $1,986,200 | $794,300 | $1,191,900 |
| 2017 | $20,837 | $1,873,800 | $749,300 | $1,124,500 |
| 2016 | $19,929 | $1,751,200 | $700,300 | $1,050,900 |
| 2015 | $19,001 | $1,636,600 | $654,500 | $982,100 |
Source: Public Records
Map
Nearby Homes
- 73 Elmore St
- 3 Cedar St
- 34 Morton Rd
- 1004 Centre St
- 887 Commonwealth Ave
- Lots 2 & 3 Chapin Rd
- Lot 3 Chapin Rd
- Lot 2 Chapin Rd
- 59 Charlotte Rd
- 95 Blake St
- 44 Irving St
- 21 Francis St Unit 21A
- 23 Francis St Unit 23-1
- 31 W Boulevard Rd
- 54 Garland Rd
- 61 Lakeview Ave
- 154 Beaumont Ave
- 92 Grant Ave
- 206-208 Cabot St
- 300 Cabot St
- 53 Morseland Ave
- 59 Morseland Ave
- 50 Morseland Ave
- 60 Cedar St
- 56 Cedar St
- 38 Morseland Ave
- 781 Commonwealth Ave
- 775 Commonwealth Ave
- 46 Cedar St
- 66 Cedar St
- 79 Elmore St
- 767 Commonwealth Ave
- 78 Elmore St Unit 78
- 78 Elmore St Unit 1
- 76 Elmore St Unit 78
- 30 Morseland Ave
- 30 Morseland Ave
- 52 Channing Rd
- 21 Morseland Ave
- 58 Channing Rd