45 Mullins Ave Duxbury, MA 02332
South Duxbury NeighborhoodEstimated Value: $748,761 - $978,000
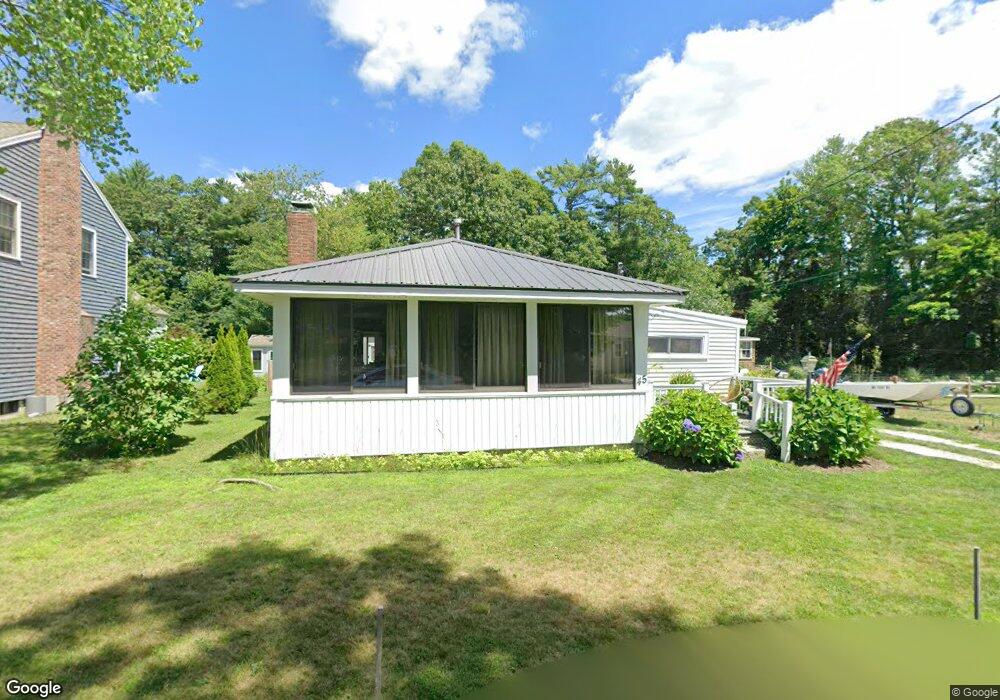
About This Home
This home is located at 45 Mullins Ave, Duxbury, MA 02332 and is currently estimated at $864,440, approximately $656 per square foot. 45 Mullins Ave is a home located in Plymouth County with nearby schools including Chandler Elementary School, Alden School, and Duxbury Middle School.
Ownership History
We collect this data history from publicly available records. To have your information removed, we recommend requesting removal directly through your county’s website.
Purchase Details
Purchase Details
Home Values in the Area
Average Home Value in this Area
Purchase History
We collect this data history from publicly available records. To have your information removed, we recommend requesting removal directly through your county’s website.
| Date | Buyer | Sale Price | Title Company |
|---|---|---|---|
| -- | -- | ||
| -- | -- | ||
| -- | -- | ||
| -- | -- |
Mortgage History
We collect this data history from publicly available records. To have your information removed, we recommend requesting removal directly through your county’s website.
| Date | Status | Borrower | Loan Amount |
|---|---|---|---|
| Previous Owner | $50,000 | ||
| Previous Owner | $82,000 | ||
| Previous Owner | $75,000 |
Tax History
We collect this data history from publicly available records. To have your information removed, we recommend requesting removal directly through your county’s website.
| Year | Tax Paid | Tax Assessment Tax Assessment Total Assessment is a certain percentage of the fair market value that is determined by local assessors to be the total taxable value of land and additions on the property. | Land | Improvement |
|---|---|---|---|---|
| 2025 | $6,341 | $625,300 | $488,200 | $137,100 |
| 2024 | $6,562 | $652,300 | $505,900 | $146,400 |
| 2023 | $5,914 | $553,200 | $395,600 | $157,600 |
| 2022 | $6,270 | $488,300 | $350,700 | $137,600 |
| 2021 | $5,806 | $401,000 | $264,800 | $136,200 |
| 2020 | $5,880 | $401,100 | $280,300 | $120,800 |
| 2019 | $5,658 | $385,400 | $255,800 | $129,600 |
| 2018 | $5,547 | $365,900 | $225,600 | $140,300 |
| 2017 | $3,445 | $222,100 | $168,400 | $53,700 |
| 2016 | $3,284 | $211,200 | $157,500 | $53,700 |
| 2015 | $3,288 | $210,800 | $157,100 | $53,700 |
Map
- 44 Seabury Point Rd
- 372 Tremont St
- 1 Flint Locke Dr
- Unit 35 Secret Pond Way Unit 35
- Unit 36 Secret Pond Way Unit 36
- 32 Wadsworth Rd
- 15 Ice House Rd
- 7 Ocean Woods Dr
- 23 Mayflower Ln
- 735 Bay Rd
- 54 Bay Farm Rd
- 26 Bay Farm Rd
- 58 Bay Farm Rd
- 80 Humphreys Ln
- 24 Holmes Ave
- 100 Parks St Unit 35
- 38 Cedar Ln
- 76 Woodridge Rd
- 15 Shore Dr
- 240 Evergreen St
Ask me questions while you tour the home.