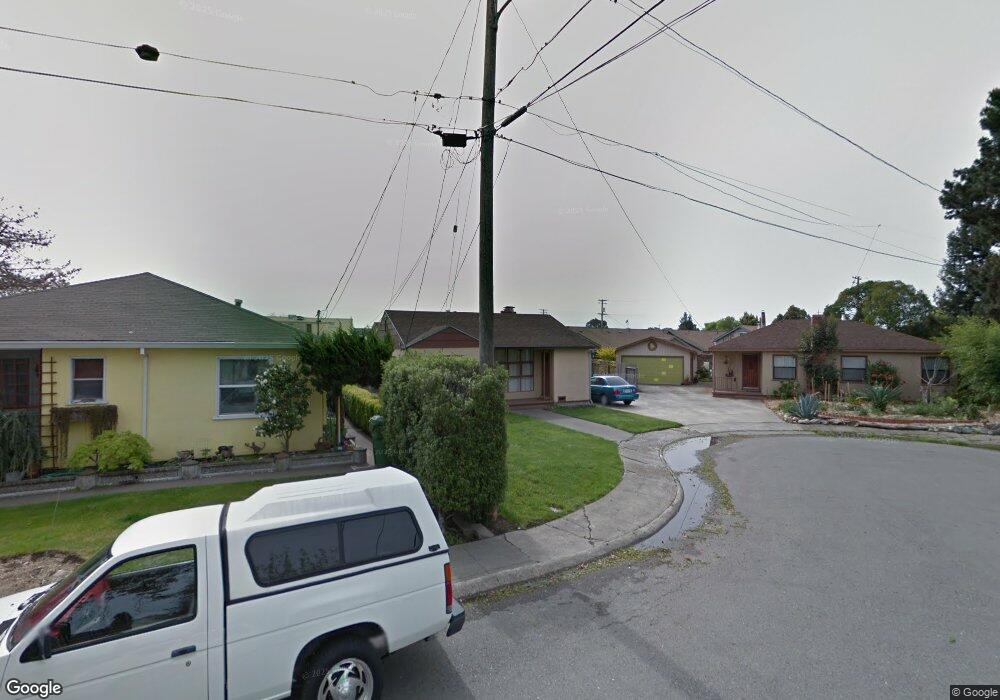
45 Myrtle Ct Petaluma, CA 94952
Midtown NeighborhoodEstimated Value: $614,668 - $813,000
2
Beds
1
Bath
955
Sq Ft
$709/Sq Ft
Est. Value
About This Home
This home is located at 45 Myrtle Ct, Petaluma, CA 94952 and is currently estimated at $677,167, approximately $709 per square foot. 45 Myrtle Ct is a home located in Sonoma County with nearby schools including McKinley Elementary School, Petaluma Junior High School, and Petaluma High School.
Ownership History
Date
Name
Owned For
Owner Type
Purchase Details
Closed on
Sep 21, 2023
Sold by
Phillip A And Lorna M Waterman Living Tr
Bought by
Waterman Phillip A
Current Estimated Value
Purchase Details
Closed on
Feb 4, 2000
Sold by
Waterman Phillip A and Waterman Lorna M
Bought by
Waterman Phillip A and Waterman Lorna M
Create a Home Valuation Report for This Property
The Home Valuation Report is an in-depth analysis detailing your home's value as well as a comparison with similar homes in the area
Home Values in the Area
Average Home Value in this Area
Purchase History
We collect this data history from publicly available records. To have your information removed, we recommend requesting removal directly through your county’s website.
| Date | Buyer | Sale Price | Title Company |
|---|---|---|---|
| Waterman Phillip A | -- | None Listed On Document | |
| Waterman Phillip A | -- | -- |
Source: Public Records
Tax History
| Year | Tax Paid | Tax Assessment Tax Assessment Total Assessment is a certain percentage of the fair market value that is determined by local assessors to be the total taxable value of land and additions on the property. | Land | Improvement |
|---|---|---|---|---|
| 2025 | $6,698 | $572,220 | $228,888 | $343,332 |
| 2024 | $943 | $65,809 | $21,919 | $43,890 |
| 2023 | $943 | $64,520 | $21,490 | $43,030 |
| 2022 | $839 | $63,256 | $21,069 | $42,187 |
| 2021 | $826 | $62,016 | $20,656 | $41,360 |
| 2020 | $5,652 | $61,381 | $20,445 | $40,936 |
| 2019 | $824 | $60,179 | $20,045 | $40,134 |
| 2018 | $821 | $59,000 | $19,652 | $39,348 |
| 2017 | $807 | $57,844 | $19,267 | $38,577 |
| 2016 | $780 | $56,711 | $18,890 | $37,821 |
| 2015 | $771 | $55,860 | $18,607 | $37,253 |
| 2014 | $768 | $54,767 | $18,243 | $36,524 |
Source: Public Records
Map
Nearby Homes
- 531 1/2 E Washington St
- 224 Vallejo St
- 48 Edith St
- 0 Lakeville St
- 315 Lakeville St
- 518 Kentucky St
- 512 Keller St
- 621 Kentucky St
- 331 Keller St Unit 6
- 137 F St
- 486 1st St
- 131 Liberty St
- 1252 Petaluma Blvd N
- 136 Court St
- 65 Freedom Ln N
- 195 Cinnabar Ave
- 835 Liberty St
- 417 F St
- 107 6th St
- 518 Galland St
Your Personal Tour Guide
Ask me questions while you tour the home.