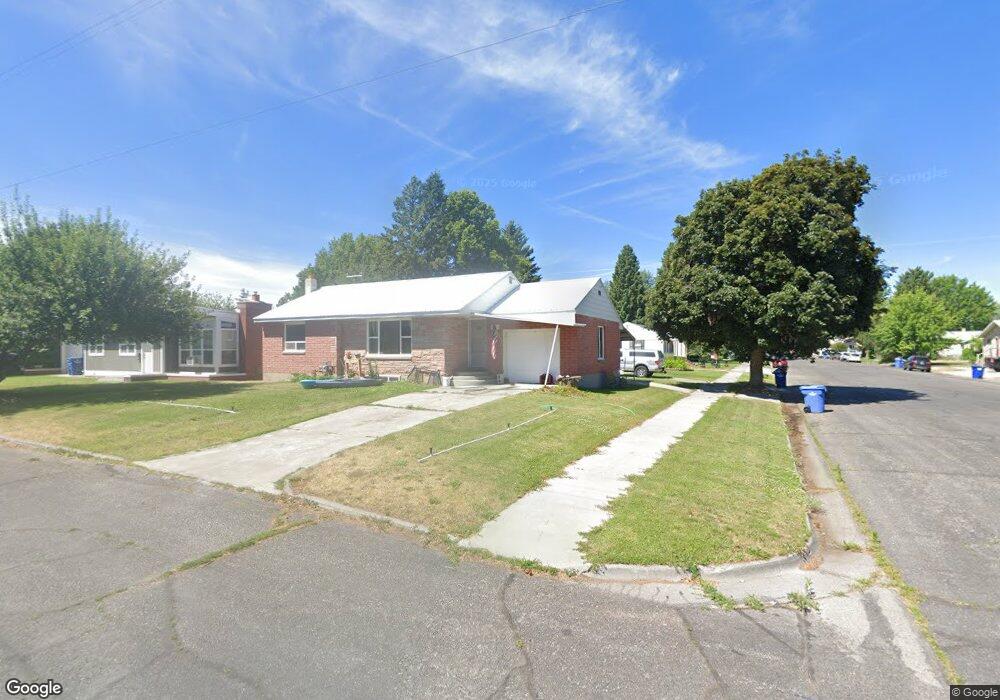
45 N 5th E Saint Anthony, ID 83445
Estimated Value: $254,000 - $295,000
3
Beds
2
Baths
1,846
Sq Ft
$151/Sq Ft
Est. Value
About This Home
This home is located at 45 N 5th E, Saint Anthony, ID 83445 and is currently estimated at $278,131, approximately $150 per square foot. 45 N 5th E is a home located in Fremont County with nearby schools including Henrys Fork Elementary School, South Fremont Junior High School, and South Fremont High School.
Ownership History
Date
Name
Owned For
Owner Type
Purchase Details
Closed on
Jul 22, 2010
Sold by
Jm Pocock Llc
Bought by
Hillman Devin K
Current Estimated Value
Home Financials for this Owner
Home Financials are based on the most recent Mortgage that was taken out on this home.
Original Mortgage
$140,621
Outstanding Balance
$93,257
Interest Rate
4.68%
Mortgage Type
New Conventional
Estimated Equity
$184,874
Create a Home Valuation Report for This Property
The Home Valuation Report is an in-depth analysis detailing your home's value as well as a comparison with similar homes in the area
Home Values in the Area
Average Home Value in this Area
Purchase History
| Date | Buyer | Sale Price | Title Company |
|---|---|---|---|
| Hillman Devin K | -- | Alliance Title & Escrow Corp |
Source: Public Records
Mortgage History
| Date | Status | Borrower | Loan Amount |
|---|---|---|---|
| Open | Hillman Devin K | $140,621 |
Source: Public Records
Tax History
| Year | Tax Paid | Tax Assessment Tax Assessment Total Assessment is a certain percentage of the fair market value that is determined by local assessors to be the total taxable value of land and additions on the property. | Land | Improvement |
|---|---|---|---|---|
| 2025 | $940 | $107,500 | $15,039 | $92,461 |
| 2024 | $868 | $95,087 | $15,039 | $80,048 |
| 2023 | $826 | $95,087 | $15,039 | $80,048 |
| 2022 | $1,070 | $78,407 | $15,039 | $63,368 |
| 2021 | $1,113 | $64,947 | $12,305 | $52,642 |
| 2020 | $1,129 | $61,611 | $12,305 | $49,306 |
| 2019 | $1,124 | $61,611 | $12,305 | $49,306 |
| 2018 | $1,068 | $54,522 | $12,305 | $42,217 |
| 2017 | $11 | $44,748 | $11,936 | $32,812 |
| 2016 | $1,052 | $44,748 | $11,936 | $32,812 |
| 2015 | $1,039 | $89,496 | $0 | $0 |
| 2014 | $804 | $44,748 | $0 | $0 |
| 2013 | $804 | $44,748 | $0 | $0 |
Source: Public Records
Map
Nearby Homes
- 247 N 3rd E
- 206 E 3rd N
- 238 W Main St
- Appx 730 Radio Rd
- 235 W 6th S
- 645 W 1st N
- 595 Bechler St
- 718 W 2nd S
- 436 W 7th S
- 745 W Main St
- TBD 8th St
- 415 Juniper View Ave
- 545 Elm Ave Unit 18
- 2985 Edgewater Ln
- TBD 2511 Del Rio Way
- 1112 Home Run Ave
- 2391 E 465 N
- 130 Industrial Park Rd
- 120 Industrial Park Rd
- 2546 E 600 N
Your Personal Tour Guide
Ask me questions while you tour the home.