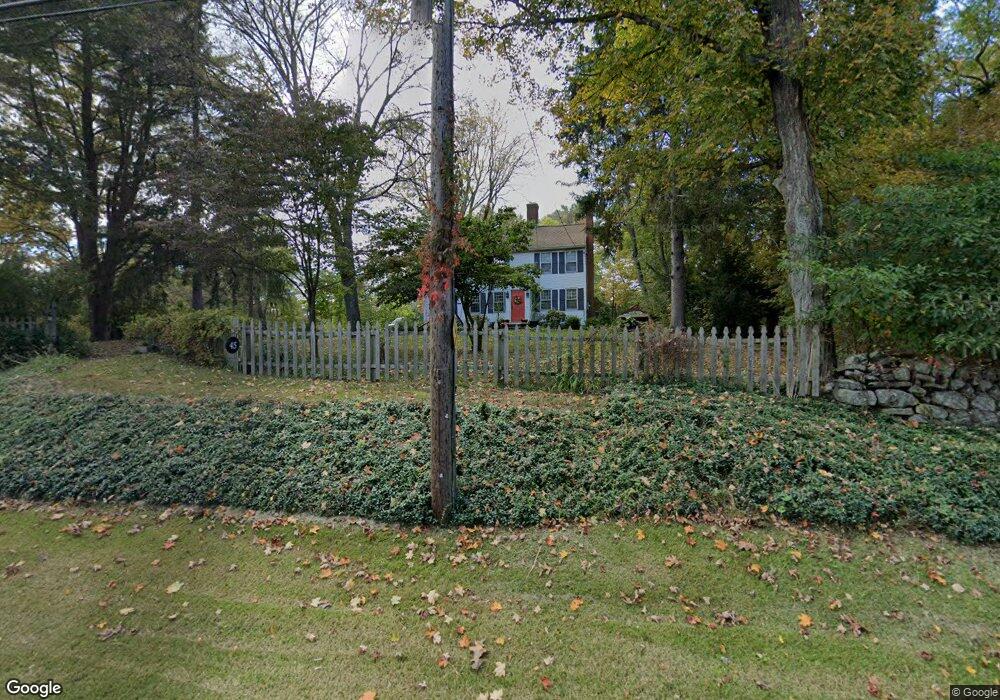
45 N Main St East Hampton, CT 06424
Estimated Value: $338,000 - $372,000
3
Beds
1
Bath
1,776
Sq Ft
$199/Sq Ft
Est. Value
About This Home
This home is located at 45 N Main St, East Hampton, CT 06424 and is currently estimated at $354,224, approximately $199 per square foot. 45 N Main St is a home located in Middlesex County with nearby schools including Memorial School, Center Elementary School, and East Hampton Middle School.
Ownership History
Date
Name
Owned For
Owner Type
Purchase Details
Closed on
Oct 4, 2024
Sold by
Goodspeed Scott
Bought by
Coelho Jeremy and Leavitt Kristen
Current Estimated Value
Home Financials for this Owner
Home Financials are based on the most recent Mortgage that was taken out on this home.
Original Mortgage
$257,050
Outstanding Balance
$254,403
Interest Rate
6.46%
Mortgage Type
Purchase Money Mortgage
Estimated Equity
$99,821
Purchase Details
Closed on
Sep 3, 2013
Sold by
Morris John
Bought by
Spuhler Maureen A and Morris John
Purchase Details
Closed on
Nov 30, 2000
Sold by
Denman Thomas E and Denman Joyce A
Bought by
Morris John and Morris Mara
Create a Home Valuation Report for This Property
The Home Valuation Report is an in-depth analysis detailing your home's value as well as a comparison with similar homes in the area
Home Values in the Area
Average Home Value in this Area
Purchase History
| Date | Buyer | Sale Price | Title Company |
|---|---|---|---|
| Coelho Jeremy | $265,000 | None Available | |
| Coelho Jeremy | $265,000 | None Available | |
| Coelho Jeremy | $265,000 | None Available | |
| Spuhler Maureen A | -- | -- | |
| Morris John | $175,000 | -- | |
| Spuhler Maureen A | -- | -- | |
| Morris John | $175,000 | -- |
Source: Public Records
Mortgage History
| Date | Status | Borrower | Loan Amount |
|---|---|---|---|
| Open | Coelho Jeremy | $257,050 | |
| Closed | Coelho Jeremy | $257,050 | |
| Previous Owner | Morris John | $140,000 | |
| Previous Owner | Morris John | $140,000 |
Source: Public Records
Tax History
| Year | Tax Paid | Tax Assessment Tax Assessment Total Assessment is a certain percentage of the fair market value that is determined by local assessors to be the total taxable value of land and additions on the property. | Land | Improvement |
|---|---|---|---|---|
| 2025 | $6,403 | $161,250 | $45,310 | $115,940 |
| 2024 | $6,134 | $161,250 | $45,320 | $115,930 |
| 2023 | $5,815 | $161,250 | $45,320 | $115,930 |
| 2022 | $5,589 | $161,250 | $45,320 | $115,930 |
| 2021 | $5,568 | $161,250 | $45,320 | $115,930 |
| 2020 | $5,336 | $161,010 | $44,580 | $116,430 |
| 2019 | $5,398 | $162,890 | $47,530 | $115,360 |
| 2018 | $5,102 | $162,890 | $47,530 | $115,360 |
| 2017 | $5,102 | $162,890 | $47,530 | $115,360 |
| 2016 | $4,795 | $162,890 | $47,530 | $115,360 |
| 2015 | $4,828 | $173,780 | $59,670 | $114,110 |
| 2014 | $4,200 | $173,780 | $59,670 | $114,110 |
Source: Public Records
Map
Nearby Homes
Your Personal Tour Guide
Ask me questions while you tour the home.