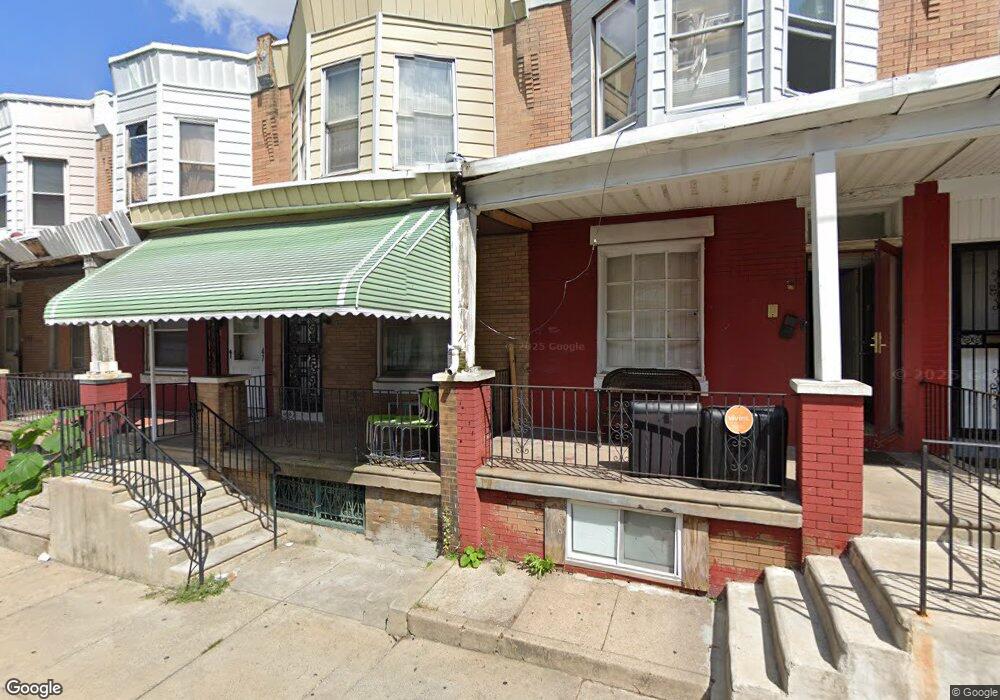
45 N Ruby St Philadelphia, PA 19139
Haddington NeighborhoodEstimated Value: $130,000 - $219,000
3
Beds
1
Bath
1,238
Sq Ft
$125/Sq Ft
Est. Value
About This Home
This home is located at 45 N Ruby St, Philadelphia, PA 19139 and is currently estimated at $154,915, approximately $125 per square foot. 45 N Ruby St is a home located in Philadelphia County with nearby schools including Alain Locke School, West Philadelphia High School, and Global Leadership Academy Charter School Southwest.
Ownership History
Date
Name
Owned For
Owner Type
Purchase Details
Closed on
Jul 19, 2018
Sold by
45 Street Properties Llc
Bought by
Williams James and Williams Janita
Current Estimated Value
Home Financials for this Owner
Home Financials are based on the most recent Mortgage that was taken out on this home.
Original Mortgage
$35,000
Outstanding Balance
$11,276
Interest Rate
4.6%
Mortgage Type
Stand Alone Second
Estimated Equity
$143,639
Purchase Details
Closed on
Aug 7, 2015
Sold by
Mial Alexander and Mial Rebecca
Bought by
45 Street Property Llc
Purchase Details
Closed on
May 2, 2000
Sold by
Mial Alexander and Mial Alice
Bought by
Mial Alexander and Mial Rebecca
Purchase Details
Closed on
Nov 12, 1999
Sold by
Mial Alexander and Estate Of Charles Mial
Bought by
Mial Alexander and Mial Alice
Create a Home Valuation Report for This Property
The Home Valuation Report is an in-depth analysis detailing your home's value as well as a comparison with similar homes in the area
Home Values in the Area
Average Home Value in this Area
Purchase History
| Date | Buyer | Sale Price | Title Company |
|---|---|---|---|
| Williams James | -- | None Available | |
| 45 Street Property Llc | -- | None Available | |
| Mial Alexander | -- | -- | |
| Mial Alexander | -- | -- |
Source: Public Records
Mortgage History
| Date | Status | Borrower | Loan Amount |
|---|---|---|---|
| Open | Williams James | $35,000 |
Source: Public Records
Tax History
| Year | Tax Paid | Tax Assessment Tax Assessment Total Assessment is a certain percentage of the fair market value that is determined by local assessors to be the total taxable value of land and additions on the property. | Land | Improvement |
|---|---|---|---|---|
| 2026 | $1,061 | $102,200 | $20,440 | $81,760 |
| 2025 | $1,061 | $102,200 | $20,440 | $81,760 |
| 2024 | $1,061 | $102,200 | $20,440 | $81,760 |
| 2023 | $1,061 | $75,800 | $15,160 | $60,640 |
| 2022 | $1,061 | $75,800 | $15,160 | $60,640 |
| 2021 | $755 | $0 | $0 | $0 |
| 2020 | $755 | $0 | $0 | $0 |
| 2019 | $726 | $0 | $0 | $0 |
| 2018 | $615 | $0 | $0 | $0 |
| 2017 | $615 | $0 | $0 | $0 |
| 2016 | $615 | $0 | $0 | $0 |
| 2015 | -- | $0 | $0 | $0 |
| 2014 | -- | $61,300 | $4,430 | $56,870 |
| 2012 | -- | $6,048 | $912 | $5,136 |
Source: Public Records
Map
Nearby Homes
Your Personal Tour Guide
Ask me questions while you tour the home.