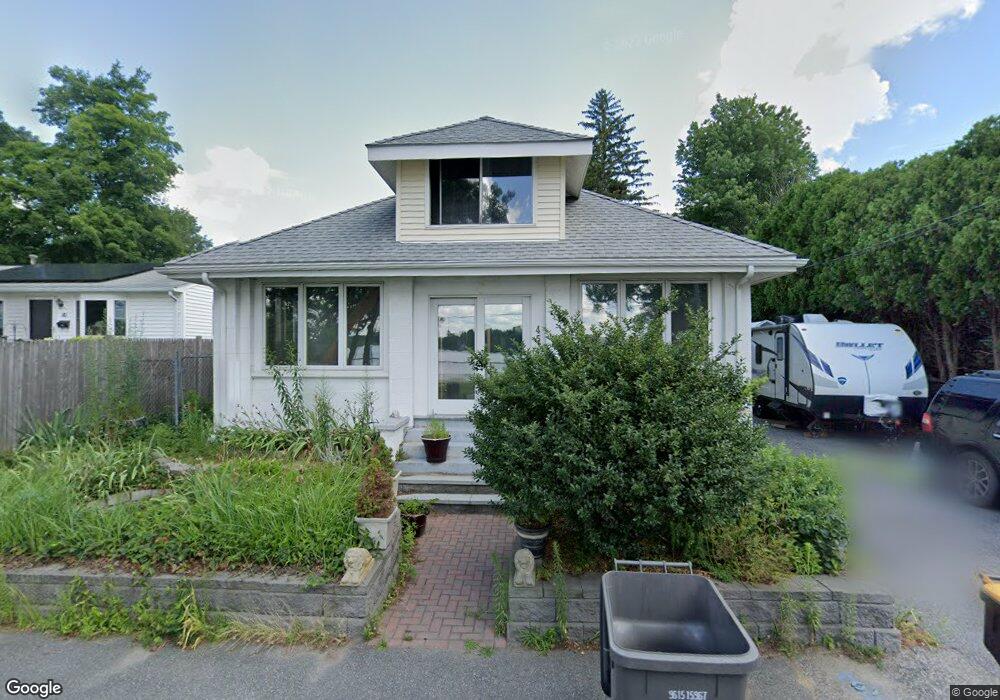
45 Nipmuc Rd Framingham, MA 01702
Estimated Value: $523,000 - $556,263
3
Beds
1
Bath
1,392
Sq Ft
$391/Sq Ft
Est. Value
About This Home
This home is located at 45 Nipmuc Rd, Framingham, MA 01702 and is currently estimated at $544,566, approximately $391 per square foot. 45 Nipmuc Rd is a home located in Middlesex County with nearby schools including Framingham High School, Pincushion Hill Montessori School, and Happy Hollow School.
Ownership History
Date
Name
Owned For
Owner Type
Purchase Details
Closed on
Jan 7, 2025
Sold by
Munroe Philip R and Munroe Helen
Bought by
Philip R & H E Munroe Ret and Munroe
Current Estimated Value
Purchase Details
Closed on
Feb 24, 1978
Bought by
Munroe Philip R and Munroe Helen
Create a Home Valuation Report for This Property
The Home Valuation Report is an in-depth analysis detailing your home's value as well as a comparison with similar homes in the area
Home Values in the Area
Average Home Value in this Area
Purchase History
| Date | Buyer | Sale Price | Title Company |
|---|---|---|---|
| Philip R & H E Munroe Ret | -- | None Available | |
| Philip R & H E Munroe Ret | -- | None Available | |
| Munroe Philip R | -- | -- |
Source: Public Records
Mortgage History
| Date | Status | Borrower | Loan Amount |
|---|---|---|---|
| Previous Owner | Munroe Philip R | $90,000 | |
| Previous Owner | Munroe Philip R | $90,000 | |
| Previous Owner | Munroe Philip R | $85,500 |
Source: Public Records
Tax History
| Year | Tax Paid | Tax Assessment Tax Assessment Total Assessment is a certain percentage of the fair market value that is determined by local assessors to be the total taxable value of land and additions on the property. | Land | Improvement |
|---|---|---|---|---|
| 2025 | $6,064 | $507,900 | $200,900 | $307,000 |
| 2024 | $5,810 | $466,300 | $178,700 | $287,600 |
| 2023 | $5,353 | $408,900 | $159,600 | $249,300 |
| 2022 | $5,063 | $368,500 | $144,800 | $223,700 |
| 2021 | $4,934 | $351,200 | $139,100 | $212,100 |
| 2020 | $4,916 | $328,200 | $121,300 | $206,900 |
| 2019 | $4,725 | $307,200 | $115,600 | $191,600 |
| 2018 | $4,588 | $281,100 | $107,600 | $173,500 |
| 2017 | $4,485 | $268,400 | $103,500 | $164,900 |
| 2016 | $4,102 | $236,000 | $97,900 | $138,100 |
| 2015 | $4,091 | $229,600 | $97,600 | $132,000 |
Source: Public Records
Map
Nearby Homes
- 69 Gilbert St
- 131 Mellen St Unit 3B
- 292 Hollis St
- 24 Bates Rd
- 25 Eames St
- 15 Bates Rd
- 92 Alexander St
- 768 Waverley St
- 10 Rhubena St
- 27 Gordon St Unit 305
- 29 Gordon St Unit 107
- 45 Daytona Ave
- 20 Mulhall Dr
- 120 Franklin St
- 18 Beaver Ct
- 15 Bellmore Rd
- 7 Weld St Unit 50
- 7 Weld St Unit 29
- 11 Weld St Unit 33
- 11 Weld St Unit 37
Your Personal Tour Guide
Ask me questions while you tour the home.