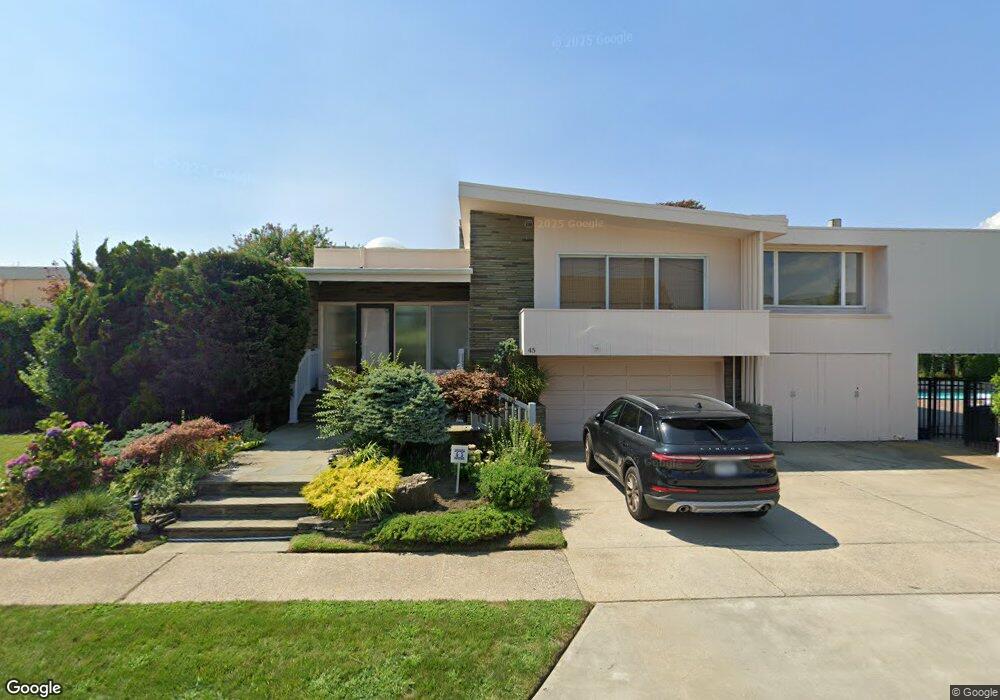
45 Oneida Ave Atlantic Beach, NY 11509
Estimated Value: $1,461,000 - $2,613,073
--
Bed
5
Baths
3,596
Sq Ft
$566/Sq Ft
Est. Value
About This Home
This home is located at 45 Oneida Ave, Atlantic Beach, NY 11509 and is currently estimated at $2,037,037, approximately $566 per square foot. 45 Oneida Ave is a home located in Nassau County with nearby schools including Lawrence Elementary School, Lawrence Primary School, and Lawrence Middle School.
Ownership History
Date
Name
Owned For
Owner Type
Purchase Details
Closed on
Jan 2, 2018
Sold by
Rebecca Steindecker Atlantic Beach Quali and John Steindecker Atlantic Beach Qualifie
Bought by
Steindecker James and Speilfogel Michelle Steindecker
Current Estimated Value
Purchase Details
Closed on
Dec 10, 2012
Sold by
Steindecker John
Bought by
Steindecker John and The Atlantic Beach Qualified Personal Re
Purchase Details
Closed on
Mar 10, 2003
Sold by
Steindecker John
Create a Home Valuation Report for This Property
The Home Valuation Report is an in-depth analysis detailing your home's value as well as a comparison with similar homes in the area
Home Values in the Area
Average Home Value in this Area
Purchase History
| Date | Buyer | Sale Price | Title Company |
|---|---|---|---|
| Steindecker James | -- | -- | |
| Steindecker James | -- | -- | |
| Steindecker James | -- | -- | |
| Steindecker John | -- | -- | |
| Steindecker John | -- | -- | |
| Steindecker Rebecca | -- | -- | |
| -- | -- | -- | |
| -- | -- | -- |
Source: Public Records
Tax History Compared to Growth
Tax History
| Year | Tax Paid | Tax Assessment Tax Assessment Total Assessment is a certain percentage of the fair market value that is determined by local assessors to be the total taxable value of land and additions on the property. | Land | Improvement |
|---|---|---|---|---|
| 2025 | $21,414 | $1,512 | $679 | $833 |
| 2024 | $6,978 | $1,520 | $683 | $837 |
| 2023 | $19,964 | $1,665 | $748 | $917 |
| 2022 | $19,964 | $1,663 | $747 | $916 |
| 2021 | $18,220 | $1,649 | $540 | $1,109 |
| 2020 | $8,075 | $1,646 | $1,165 | $481 |
| 2019 | $5,534 | $1,764 | $1,170 | $594 |
| 2018 | $11,629 | $1,881 | $0 | $0 |
| 2017 | $12,165 | $1,999 | $1,179 | $820 |
| 2016 | $17,709 | $2,116 | $1,123 | $993 |
| 2015 | $6,122 | $2,234 | $1,056 | $1,178 |
| 2014 | $6,122 | $2,234 | $1,056 | $1,178 |
| 2013 | $6,111 | $2,352 | $1,112 | $1,240 |
Source: Public Records
Map
Nearby Homes