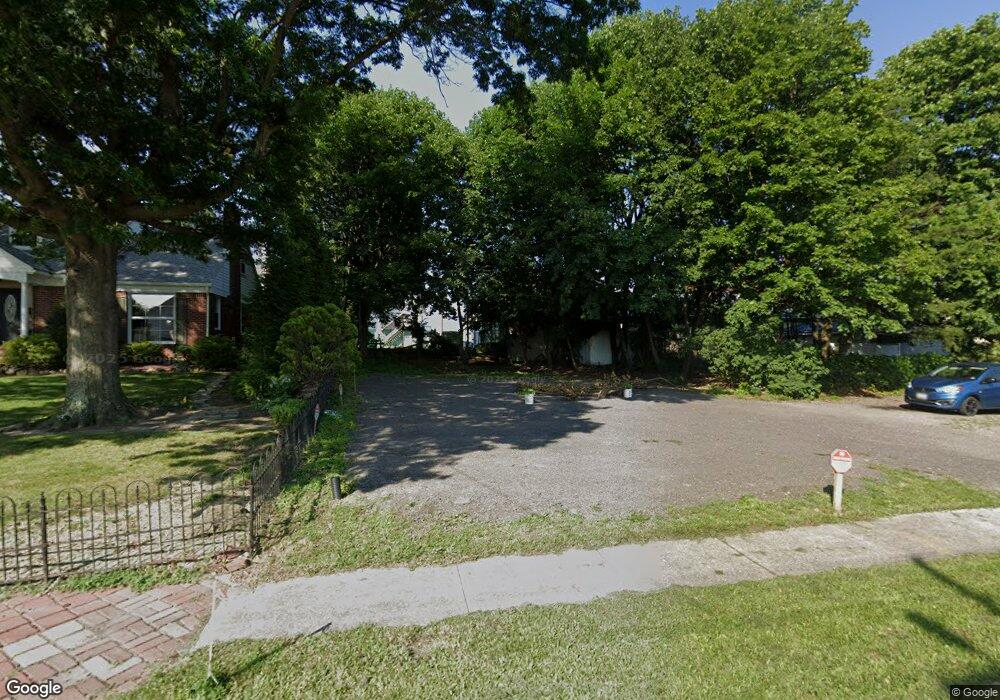
45 Ormand St Frostburg, MD 21532
Estimated Value: $60,000 - $67,753
1
Bed
1
Bath
828
Sq Ft
$77/Sq Ft
Est. Value
About This Home
This home is located at 45 Ormand St, Frostburg, MD 21532 and is currently estimated at $63,438, approximately $76 per square foot. 45 Ormand St is a home located in Allegany County with nearby schools including Beall Elementary School, Mount Savage Middle School, and Mountain Ridge High School.
Ownership History
Date
Name
Owned For
Owner Type
Purchase Details
Closed on
Aug 29, 2024
Sold by
Seminerio Lorenzo and Seminerio Tammy J
Bought by
Seminerio Lorenzo and Seminerio Tammy J
Current Estimated Value
Purchase Details
Closed on
Nov 17, 2022
Sold by
City Of Frostburg
Bought by
Seminerio Lorenzo and Seminerio Tammy J
Purchase Details
Closed on
Apr 26, 2022
Sold by
Bennett Jason M
Bought by
City Of Frostburg
Purchase Details
Closed on
Jul 16, 2014
Sold by
Darchicourt Thomas E and Rhodes Heather A
Bought by
Banados Danilo C
Purchase Details
Closed on
May 5, 2011
Sold by
Gordon Ronald J
Bought by
Darchicourt Thomas E and Darchicourt Heather A
Purchase Details
Closed on
Apr 29, 2011
Sold by
Gordon Ronald J
Bought by
Darchicourt Thomas E and Darchicourt Heather A
Purchase Details
Closed on
May 2, 2003
Sold by
Gordon Ronald J and Gordon Amy M
Bought by
Gordon Ronald J
Purchase Details
Closed on
Aug 13, 2001
Sold by
Sayler John L
Bought by
Cotton David and Cotton Maria
Purchase Details
Closed on
Aug 18, 1994
Sold by
Johnson Violet P and Johnson Richard D
Bought by
Stahl Peter and Stahl Peter R
Create a Home Valuation Report for This Property
The Home Valuation Report is an in-depth analysis detailing your home's value as well as a comparison with similar homes in the area
Home Values in the Area
Average Home Value in this Area
Purchase History
We collect this data history from publicly available records. To have your information removed, we recommend requesting removal directly through your county’s website.
| Date | Buyer | Sale Price | Title Company |
|---|---|---|---|
| Seminerio Lorenzo | -- | None Listed On Document | |
| Seminerio Lorenzo | -- | -- | |
| City Of Frostburg | -- | None Listed On Document | |
| Banados Danilo C | $40,000 | Goldstar Title Company | |
| Darchicourt Thomas E | $32,000 | -- | |
| Darchicourt Thomas E | $32,000 | -- | |
| Gordon Ronald J | -- | -- | |
| Cotton David | $15,000 | -- | |
| Gordon Ronald J | $21,000 | -- | |
| Stahl Peter | $40,300 | -- |
Source: Public Records
Mortgage History
We collect this data history from publicly available records. To have your information removed, we recommend requesting removal directly through your county’s website.
| Date | Status | Borrower | Loan Amount |
|---|---|---|---|
| Closed | Gordon Ronald J | -- |
Source: Public Records
Tax History
| Year | Tax Paid | Tax Assessment Tax Assessment Total Assessment is a certain percentage of the fair market value that is determined by local assessors to be the total taxable value of land and additions on the property. | Land | Improvement |
|---|---|---|---|---|
| 2025 | $122 | $12,000 | $12,000 | $0 |
| 2024 | $56 | $5,400 | $5,400 | $0 |
| 2023 | $55 | $5,400 | $5,400 | $0 |
| 2022 | $377 | $37,300 | $12,000 | $25,300 |
| 2021 | $377 | $37,033 | $0 | $0 |
| 2020 | $361 | $36,767 | $0 | $0 |
| 2019 | $361 | $36,500 | $12,000 | $24,500 |
| 2018 | $349 | $35,067 | $0 | $0 |
| 2017 | $310 | $33,633 | $0 | $0 |
| 2016 | $0 | $32,200 | $0 | $0 |
| 2015 | $315 | $32,200 | $0 | $0 |
| 2014 | $315 | $32,200 | $0 | $0 |
Source: Public Records
Map
Nearby Homes
Your Personal Tour Guide
Ask me questions while you tour the home.