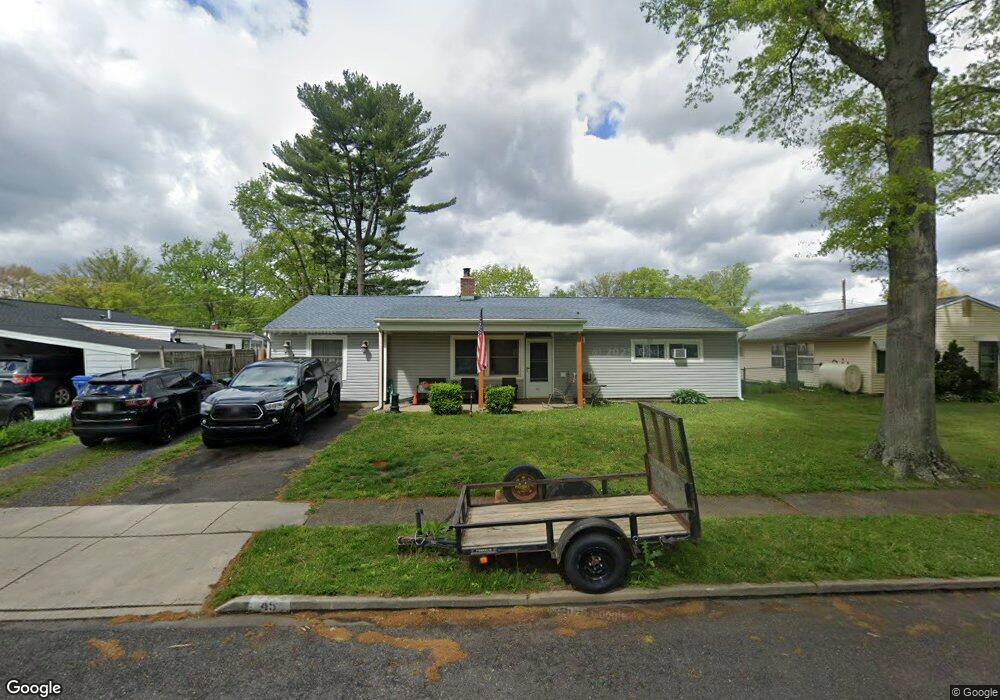
45 Outlook Ln Levittown, PA 19055
Oaktree Hollow NeighborhoodEstimated Value: $279,000 - $384,199
3
Beds
1
Bath
1,584
Sq Ft
$215/Sq Ft
Est. Value
About This Home
This home is located at 45 Outlook Ln, Levittown, PA 19055 and is currently estimated at $341,300, approximately $215 per square foot. 45 Outlook Ln is a home located in Bucks County with nearby schools including Truman Senior High School, Hope Lutheran School, and Emilie Christian Day School.
Ownership History
Date
Name
Owned For
Owner Type
Purchase Details
Closed on
Jun 1, 2000
Sold by
Hud and Albertelli Dale
Bought by
Curran Matthew P and Curran Michelle
Current Estimated Value
Home Financials for this Owner
Home Financials are based on the most recent Mortgage that was taken out on this home.
Original Mortgage
$77,900
Outstanding Balance
$27,267
Interest Rate
8.12%
Estimated Equity
$314,033
Purchase Details
Closed on
Feb 17, 2000
Sold by
Bank Of America Fsb
Bought by
Hud
Purchase Details
Closed on
Sep 21, 1999
Sold by
Kellett Michael J
Bought by
Bank Of America Fsb
Purchase Details
Closed on
Apr 30, 1996
Sold by
Anen Richard C and Anen Tina M
Bought by
Kellett Michael J
Home Financials for this Owner
Home Financials are based on the most recent Mortgage that was taken out on this home.
Original Mortgage
$89,673
Interest Rate
7.67%
Mortgage Type
FHA
Create a Home Valuation Report for This Property
The Home Valuation Report is an in-depth analysis detailing your home's value as well as a comparison with similar homes in the area
Home Values in the Area
Average Home Value in this Area
Purchase History
| Date | Buyer | Sale Price | Title Company |
|---|---|---|---|
| Curran Matthew P | $82,000 | -- | |
| Hud | -- | -- | |
| Bank Of America Fsb | $1,206 | -- | |
| Kellett Michael J | $89,900 | -- |
Source: Public Records
Mortgage History
| Date | Status | Borrower | Loan Amount |
|---|---|---|---|
| Open | Curran Matthew P | $77,900 | |
| Previous Owner | Kellett Michael J | $89,673 |
Source: Public Records
Tax History Compared to Growth
Tax History
| Year | Tax Paid | Tax Assessment Tax Assessment Total Assessment is a certain percentage of the fair market value that is determined by local assessors to be the total taxable value of land and additions on the property. | Land | Improvement |
|---|---|---|---|---|
| 2025 | $5,176 | $19,060 | $4,600 | $14,460 |
| 2024 | $5,176 | $19,060 | $4,600 | $14,460 |
| 2023 | $5,138 | $19,060 | $4,600 | $14,460 |
| 2022 | $5,138 | $19,060 | $4,600 | $14,460 |
| 2021 | $5,138 | $19,060 | $4,600 | $14,460 |
| 2020 | $4,844 | $17,970 | $4,600 | $13,370 |
| 2019 | $4,826 | $17,970 | $4,600 | $13,370 |
| 2018 | $4,749 | $17,970 | $4,600 | $13,370 |
| 2017 | $4,676 | $17,970 | $4,600 | $13,370 |
| 2016 | $4,676 | $17,970 | $4,600 | $13,370 |
| 2015 | $3,353 | $17,970 | $4,600 | $13,370 |
| 2014 | $3,353 | $17,970 | $4,600 | $13,370 |
Source: Public Records
Map
Nearby Homes
- 28 Outlook Ln
- 225 Oaktree Dr
- 2 Red Maple Ln
- 29 Graceful Ln
- 24 Robin Hill Ln
- 27 Good Ln
- 84 Daffodil Ln
- 90 Cedar Cir Unit 66
- 10 Ivy Ln
- 11 Crimson King Ln
- 20 Fireside Ln
- The Manchester Plan at Villas at Greenbrook
- The Nottingham Plan at Villas at Greenbrook
- The Chancellor Plan at Villas at Greenbrook
- The Greenbrook Plan at Villas at Greenbrook
- The Margate Plan at Villas at Greenbrook
- The Abbot Plan at Villas at Greenbrook
- 24 Chestnut Ln
- 12 Ivy Ln
- 179 Crabtree Dr