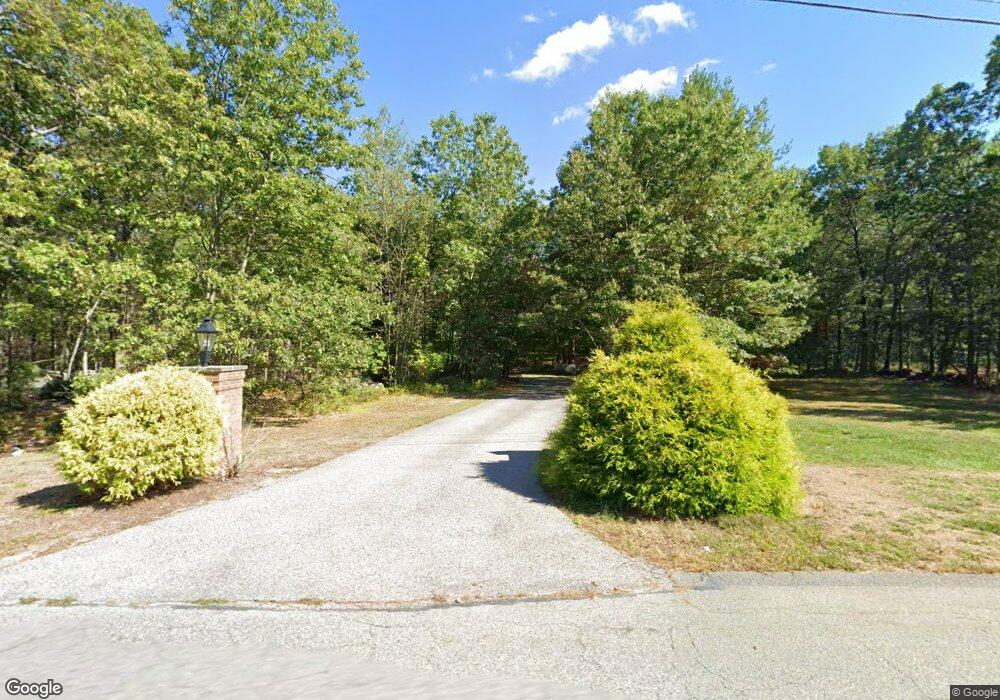
45 Painted Post Rd Groton, MA 01450
Estimated Value: $1,051,000 - $1,435,000
4
Beds
3
Baths
3,700
Sq Ft
$317/Sq Ft
Est. Value
About This Home
This home is located at 45 Painted Post Rd, Groton, MA 01450 and is currently estimated at $1,171,966, approximately $316 per square foot. 45 Painted Post Rd is a home located in Middlesex County with nearby schools including Groton Dunstable Regional High School and Lawrence Academy.
Ownership History
Date
Name
Owned For
Owner Type
Purchase Details
Closed on
Jul 12, 2012
Sold by
Acaba Ralph H and Acaba Elizabeth A
Bought by
Ralph H Acaba Int H and Ralph Acaba
Current Estimated Value
Purchase Details
Closed on
Apr 25, 2012
Sold by
Ralph H Acaba Invst T H and Ralph Acaba
Bought by
Acaba Ralph H and Acaba Elizabeth A
Home Financials for this Owner
Home Financials are based on the most recent Mortgage that was taken out on this home.
Original Mortgage
$550,000
Interest Rate
3.91%
Mortgage Type
Purchase Money Mortgage
Purchase Details
Closed on
Jul 19, 2004
Sold by
Pastore Cynthia A and Pastore Michael J
Bought by
Acaba Elizabeth A and Acaba Ralph H
Purchase Details
Closed on
Mar 28, 2002
Sold by
Hughes Joel S and Hughes Mary Ann
Bought by
Pastore Michael J and Pastore Cynthia A
Create a Home Valuation Report for This Property
The Home Valuation Report is an in-depth analysis detailing your home's value as well as a comparison with similar homes in the area
Home Values in the Area
Average Home Value in this Area
Purchase History
| Date | Buyer | Sale Price | Title Company |
|---|---|---|---|
| Ralph H Acaba Int H | -- | -- | |
| Int Ralph H Acaba | -- | -- | |
| Acaba Ralph H | -- | -- | |
| Acaba Ralph H | -- | -- | |
| Acaba Ralph H | -- | -- | |
| Acaba Elizabeth A | $695,000 | -- | |
| Acaba Elizabeth A | $695,000 | -- | |
| Pastore Michael J | $619,000 | -- | |
| Pastore Michael J | $619,000 | -- |
Source: Public Records
Mortgage History
| Date | Status | Borrower | Loan Amount |
|---|---|---|---|
| Previous Owner | Acaba Ralph H | $550,000 |
Source: Public Records
Tax History
| Year | Tax Paid | Tax Assessment Tax Assessment Total Assessment is a certain percentage of the fair market value that is determined by local assessors to be the total taxable value of land and additions on the property. | Land | Improvement |
|---|---|---|---|---|
| 2025 | $14,632 | $959,500 | $322,100 | $637,400 |
| 2024 | $14,230 | $943,000 | $322,100 | $620,900 |
| 2023 | $13,516 | $864,200 | $322,100 | $542,100 |
| 2022 | $12,097 | $703,700 | $258,500 | $445,200 |
| 2021 | $11,920 | $677,300 | $234,500 | $442,800 |
| 2020 | $12,011 | $691,100 | $253,300 | $437,800 |
| 2019 | $11,641 | $642,800 | $272,100 | $370,700 |
| 2018 | $11,415 | $611,400 | $262,700 | $348,700 |
| 2017 | $11,164 | $611,400 | $262,700 | $348,700 |
| 2016 | $10,537 | $561,100 | $220,400 | $340,700 |
| 2015 | $10,251 | $561,100 | $220,400 | $340,700 |
Source: Public Records
Map
Nearby Homes
- 1081 Lowell Rd
- 38 Groton Rd
- 6 Little Hollow Ln
- 1 Little Hollow Ln
- 34 West St
- 14 Island Rd
- 176 Whiley Rd
- 23 Apache Way Unit 23
- 95 Lost Lake Dr
- 52 Allens Trail
- 9 Elm St
- 10 Laurel Ln
- 15 Gilson Rd
- 3 Hillside Ave
- 797 Boston Rd
- 12 Oriole Dr
- Lot 2 Monarch Path
- Lot 1 Monarch Path
- 0 Old Dunstable Rd
- 18 B Pilgrim Dr Unit 18b
- 29 Painted Post Rd
- 38 Painted Post Rd
- 46 Painted Post Rd
- 19 Painted Post Rd
- 52 Painted Post Rd
- 34 Painted Post Rd
- 65 Painted Post Rd
- 30 Painted Post Rd
- 42 Painted Post Rd
- 20 Painted Post Rd
- 11 Painted Post Rd
- 67 Painted Post Rd
- 0 Lot 3a Painted Post Rd Unit 50383939
- 1036 Lowell Rd
- 6 Amanda Way
- 64 Painted Post Rd
- 1038 Lowell Rd
- 56 Painted Post Rd
- 69 Painted Post Rd
- 4 Amanda Way
Your Personal Tour Guide
Ask me questions while you tour the home.