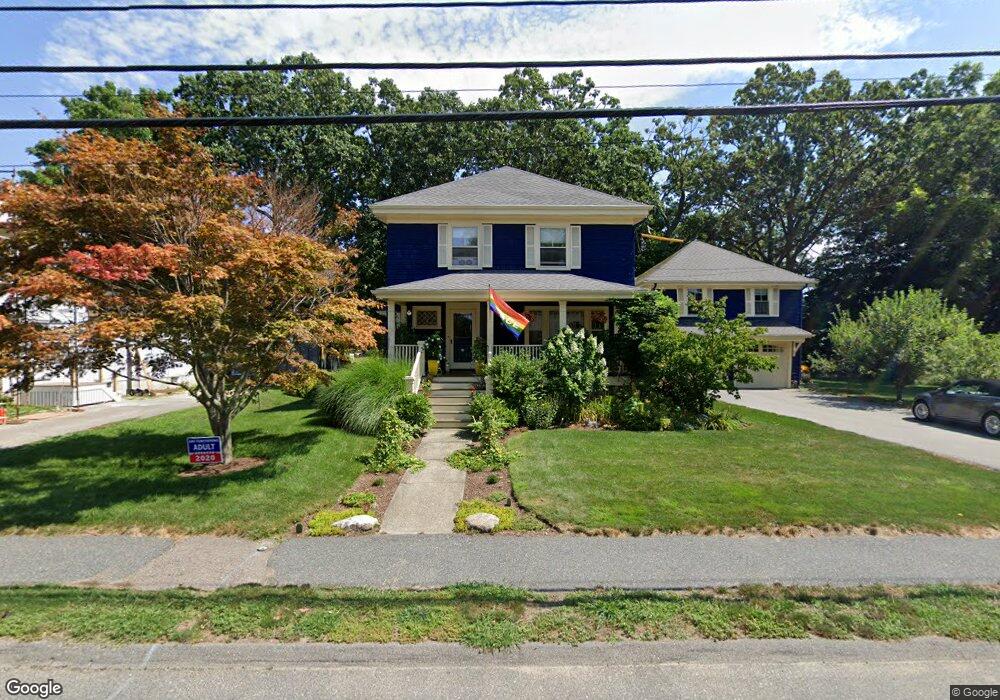
45 Park Ave Natick, MA 01760
Estimated Value: $1,147,000 - $1,190,000
4
Beds
4
Baths
2,891
Sq Ft
$405/Sq Ft
Est. Value
About This Home
This home is located at 45 Park Ave, Natick, MA 01760 and is currently estimated at $1,170,327, approximately $404 per square foot. 45 Park Ave is a home located in Middlesex County with nearby schools including Natick High School, Wilson Middle School, and Bennett-Hemenway (Ben-Hem) Elementary School.
Ownership History
Date
Name
Owned For
Owner Type
Purchase Details
Closed on
Jan 23, 1992
Sold by
Liffers Mark L and Liffers Noreen G
Bought by
Gees Conrad P and Gees Amanda L
Current Estimated Value
Home Financials for this Owner
Home Financials are based on the most recent Mortgage that was taken out on this home.
Original Mortgage
$160,000
Interest Rate
8.45%
Mortgage Type
Purchase Money Mortgage
Create a Home Valuation Report for This Property
The Home Valuation Report is an in-depth analysis detailing your home's value as well as a comparison with similar homes in the area
Home Values in the Area
Average Home Value in this Area
Purchase History
| Date | Buyer | Sale Price | Title Company |
|---|---|---|---|
| Gees Conrad P | $208,000 | -- |
Source: Public Records
Mortgage History
| Date | Status | Borrower | Loan Amount |
|---|---|---|---|
| Open | Gees Conrad P | $200,000 | |
| Closed | Gees Conrad P | $210,000 | |
| Closed | Gees Conrad P | $160,000 | |
| Closed | Gees Conrad P | $160,000 |
Source: Public Records
Tax History
| Year | Tax Paid | Tax Assessment Tax Assessment Total Assessment is a certain percentage of the fair market value that is determined by local assessors to be the total taxable value of land and additions on the property. | Land | Improvement |
|---|---|---|---|---|
| 2025 | $11,852 | $991,000 | $432,300 | $558,700 |
| 2024 | $11,385 | $928,600 | $408,300 | $520,300 |
| 2023 | $10,994 | $869,800 | $384,300 | $485,500 |
| 2022 | $10,591 | $793,900 | $350,700 | $443,200 |
| 2021 | $10,141 | $745,100 | $331,400 | $413,700 |
| 2020 | $9,945 | $730,700 | $317,000 | $413,700 |
| 2019 | $9,287 | $730,700 | $317,000 | $413,700 |
| 2018 | $3,638 | $702,500 | $288,200 | $414,300 |
| 2017 | $8,922 | $661,400 | $254,600 | $406,800 |
| 2016 | $8,724 | $642,900 | $239,800 | $403,100 |
| 2015 | $7,904 | $571,900 | $239,800 | $332,100 |
Source: Public Records
Map
Nearby Homes
- 43 Charles St
- 41 Charles St
- 7 Jackson Ct Unit B
- 27 2nd St
- 293 Bacon St Unit A
- 9 Bellevue Rd
- 142 Bacon St
- 20 Florence St Unit B
- 16 Harvard St
- 17 Florence St
- 32 Harvard St
- 49 Summer St
- 58 W Central St
- 12 Bay State Rd
- 4 Richard Rd
- 3 Vale St Unit A
- 53 Harvard Street Extension
- 25 Irving Rd
- 63 Pond St
- 98 W Central St
Your Personal Tour Guide
Ask me questions while you tour the home.