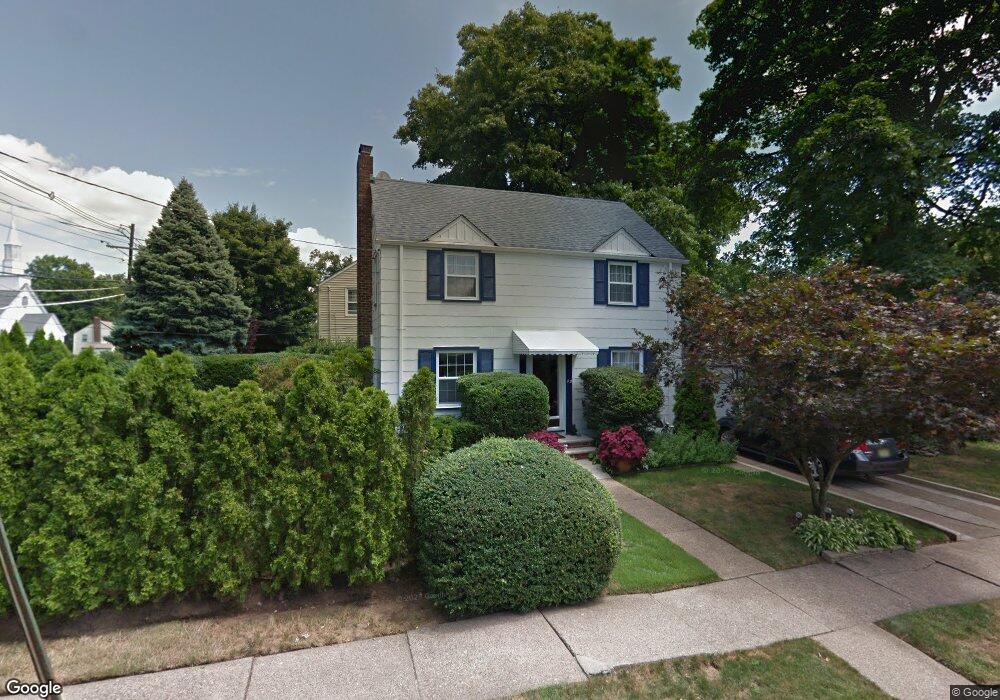
45 Phillips St Bloomfield, NJ 07003
Estimated Value: $531,077 - $638,000
--
Bed
--
Bath
1,176
Sq Ft
$486/Sq Ft
Est. Value
About This Home
This home is located at 45 Phillips St, Bloomfield, NJ 07003 and is currently estimated at $571,269, approximately $485 per square foot. 45 Phillips St is a home located in Essex County with nearby schools including Demarest School, Bloomfield Middle School, and Bloomfield High School.
Ownership History
Date
Name
Owned For
Owner Type
Purchase Details
Closed on
Nov 14, 2018
Sold by
Schnall John and Borges Luciano
Bought by
Schnall John and Borges Luciano
Current Estimated Value
Purchase Details
Closed on
Nov 8, 2004
Purchase Details
Closed on
May 1, 1999
Sold by
Freeman Charles
Bought by
Schnall John
Home Financials for this Owner
Home Financials are based on the most recent Mortgage that was taken out on this home.
Original Mortgage
$141,550
Interest Rate
6.88%
Purchase Details
Closed on
Feb 9, 1989
Sold by
Scimone Phyllis
Bought by
Freeman Charles R
Create a Home Valuation Report for This Property
The Home Valuation Report is an in-depth analysis detailing your home's value as well as a comparison with similar homes in the area
Home Values in the Area
Average Home Value in this Area
Purchase History
| Date | Buyer | Sale Price | Title Company |
|---|---|---|---|
| Schnall John | -- | -- | |
| -- | -- | -- | |
| Schnall John | $149,000 | -- | |
| Freeman Charles R | $179,000 | -- |
Source: Public Records
Mortgage History
| Date | Status | Borrower | Loan Amount |
|---|---|---|---|
| Previous Owner | Schnall John | $141,550 |
Source: Public Records
Tax History Compared to Growth
Tax History
| Year | Tax Paid | Tax Assessment Tax Assessment Total Assessment is a certain percentage of the fair market value that is determined by local assessors to be the total taxable value of land and additions on the property. | Land | Improvement |
|---|---|---|---|---|
| 2025 | $10,441 | $319,500 | $136,600 | $182,900 |
| 2024 | $10,441 | $319,500 | $136,600 | $182,900 |
| 2022 | $10,230 | $319,500 | $136,600 | $182,900 |
| 2021 | $10,042 | $319,500 | $136,600 | $182,900 |
| 2020 | $9,889 | $319,500 | $136,600 | $182,900 |
| 2019 | $10,319 | $259,200 | $134,900 | $124,300 |
| 2018 | $10,275 | $259,200 | $134,900 | $124,300 |
| 2017 | $10,119 | $259,200 | $134,900 | $124,300 |
| 2016 | $10,005 | $259,200 | $134,900 | $124,300 |
| 2015 | $9,914 | $259,200 | $134,900 | $124,300 |
| 2014 | $9,733 | $259,200 | $134,900 | $124,300 |
Source: Public Records
Map
Nearby Homes