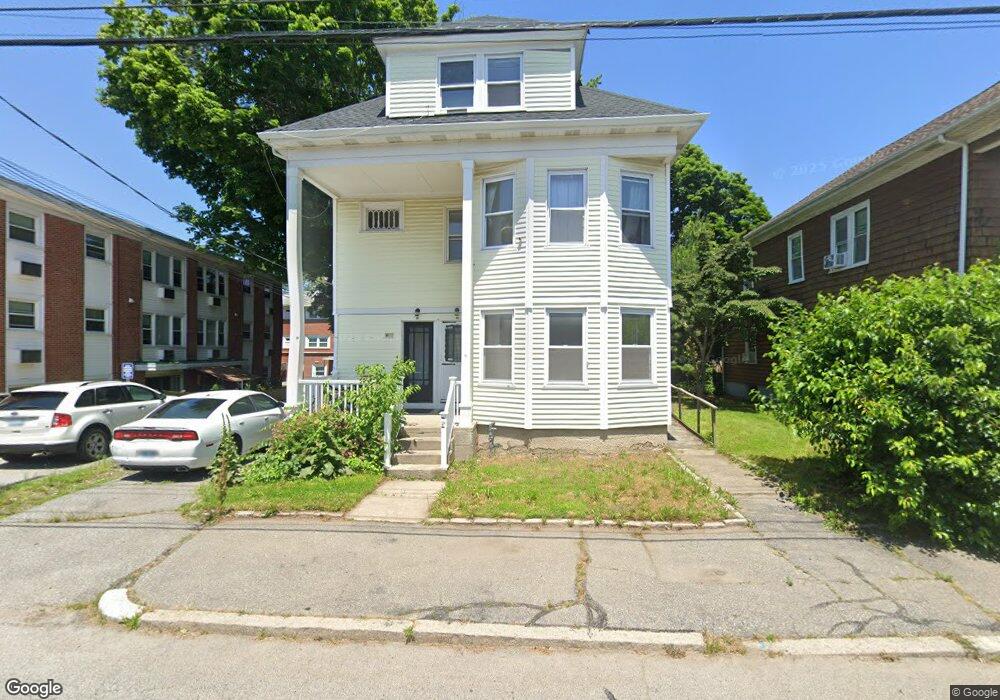
45 Pidge Ave Pawtucket, RI 02860
Oak Hill NeighborhoodEstimated Value: $584,521 - $706,000
5
Beds
3
Baths
2,776
Sq Ft
$230/Sq Ft
Est. Value
About This Home
This home is located at 45 Pidge Ave, Pawtucket, RI 02860 and is currently estimated at $638,880, approximately $230 per square foot. 45 Pidge Ave is a home located in Providence County with nearby schools including International Charter School, Blackstone Academy Charter School, and Jewish Community Day School Of Rhode Island.
Ownership History
Date
Name
Owned For
Owner Type
Purchase Details
Closed on
Jul 17, 2025
Sold by
Pawtucket City Of
Bought by
St James Investments Llc
Current Estimated Value
Purchase Details
Closed on
Oct 1, 1997
Sold by
Dromgoole Francis M and Dromgoole Louise
Bought by
Caldwell William H
Home Financials for this Owner
Home Financials are based on the most recent Mortgage that was taken out on this home.
Original Mortgage
$127,300
Interest Rate
7.41%
Mortgage Type
Purchase Money Mortgage
Create a Home Valuation Report for This Property
The Home Valuation Report is an in-depth analysis detailing your home's value as well as a comparison with similar homes in the area
Home Values in the Area
Average Home Value in this Area
Purchase History
| Date | Buyer | Sale Price | Title Company |
|---|---|---|---|
| St James Investments Llc | $41,963 | -- | |
| St James Investments Llc | $41,963 | -- | |
| Caldwell William H | $135,000 | -- | |
| Caldwell William H | $135,000 | -- |
Source: Public Records
Mortgage History
| Date | Status | Borrower | Loan Amount |
|---|---|---|---|
| Previous Owner | Caldwell William H | $59,000 | |
| Previous Owner | Caldwell William H | $164,000 | |
| Previous Owner | Caldwell William H | $127,300 |
Source: Public Records
Tax History
| Year | Tax Paid | Tax Assessment Tax Assessment Total Assessment is a certain percentage of the fair market value that is determined by local assessors to be the total taxable value of land and additions on the property. | Land | Improvement |
|---|---|---|---|---|
| 2025 | $6,380 | $485,200 | $160,000 | $325,200 |
| 2024 | $5,987 | $485,200 | $160,000 | $325,200 |
| 2023 | $5,267 | $310,900 | $89,700 | $221,200 |
| 2022 | $5,155 | $310,900 | $89,700 | $221,200 |
| 2021 | $5,155 | $310,900 | $89,700 | $221,200 |
| 2020 | $4,065 | $194,600 | $64,100 | $130,500 |
| 2019 | $4,065 | $194,600 | $64,100 | $130,500 |
| 2018 | $3,917 | $194,600 | $64,100 | $130,500 |
| 2017 | $4,106 | $180,700 | $72,300 | $108,400 |
| 2016 | $3,956 | $180,700 | $72,300 | $108,400 |
| 2015 | $3,956 | $180,700 | $72,300 | $108,400 |
| 2014 | $3,311 | $143,600 | $72,300 | $71,300 |
Source: Public Records
Map
Nearby Homes
- 122 Lowden St
- 136 Hillside Ave
- 6 Alfred Stone Rd
- 32 Carver St
- 80 Hillside Ave
- 41 Campbell Terrace
- 11 Sherman St
- 126 Dunnell Ave
- 540 Blackstone Blvd
- 62 Harwich Rd
- 39 Harwich Rd
- 153 4th St
- 159 Dunnell Ave
- 187 Sisson St
- 158 Newell Ave
- 50 Jefferson Ave
- 54 Jefferson Ave
- 349 Pleasant St
- 202 Rochambeau Ave Unit 2
- 167 George St
- 43 Pidge Ave
- 43 Pidge Ave Unit 2
- 41 Pidge Ave
- 37 Pidge Ave Unit 1
- 35 Pidge Ave
- 35 Pidge Ave Unit 2
- 138 Lowden St
- 33 Pidge Ave
- 0 Unity St Unit 534985
- 0 Unity St Unit 534988
- 0 Unity St
- 57 Pidge Ave
- 134 Lowden St
- 78 Dartmouth St
- 180 Lowden St
- 0 Lowden St
- 155 Lowden St
- 27 Pidge Ave
- 63 Pidge Ave
- 149 Lowden St
Your Personal Tour Guide
Ask me questions while you tour the home.