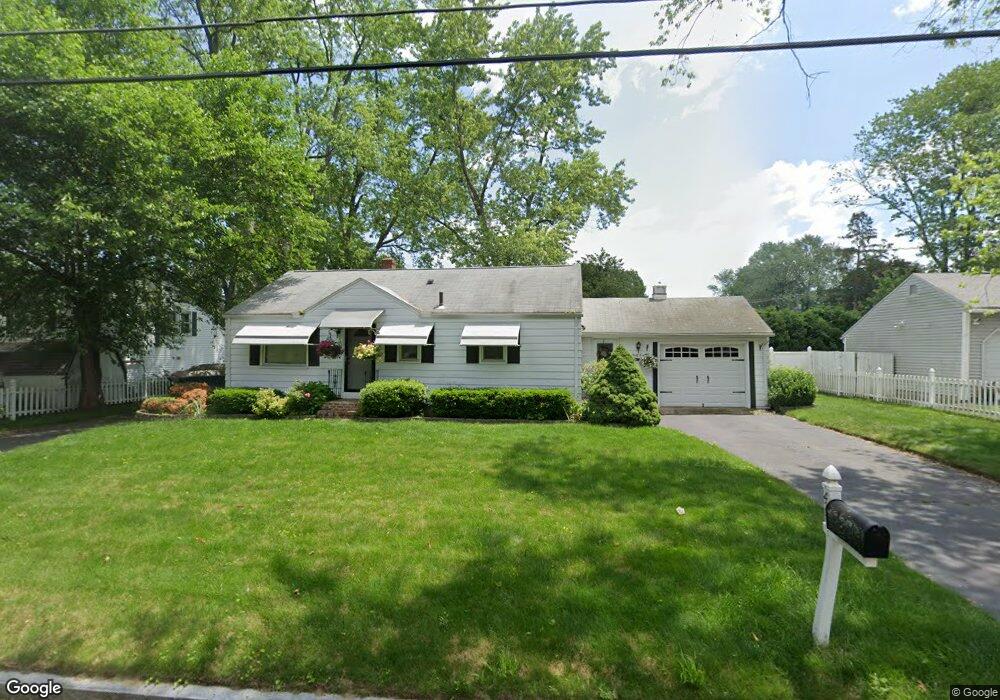
45 Pineview Dr Springfield, MA 01119
Sixteen Acres NeighborhoodEstimated Value: $280,000 - $294,000
3
Beds
1
Bath
864
Sq Ft
$332/Sq Ft
Est. Value
About This Home
This home is located at 45 Pineview Dr, Springfield, MA 01119 and is currently estimated at $286,615, approximately $331 per square foot. 45 Pineview Dr is a home located in Hampden County with nearby schools including Glickman Elementary, John J Duggan Middle, and Springfield High School of Science and Technology.
Ownership History
Date
Name
Owned For
Owner Type
Purchase Details
Closed on
Oct 2, 2006
Sold by
Fnma
Bought by
Mortgage Guaranty Inc
Current Estimated Value
Home Financials for this Owner
Home Financials are based on the most recent Mortgage that was taken out on this home.
Original Mortgage
$100,000
Outstanding Balance
$59,252
Interest Rate
6.52%
Mortgage Type
Purchase Money Mortgage
Estimated Equity
$227,363
Purchase Details
Closed on
Nov 2, 2005
Sold by
Mortgage Electronic Re and Filiault
Bought by
Federal National Mortgage Association
Purchase Details
Closed on
Nov 8, 2002
Sold by
Chrisanthopoulos George J and Christopher James M
Bought by
Filiault Rosann M
Home Financials for this Owner
Home Financials are based on the most recent Mortgage that was taken out on this home.
Original Mortgage
$107,100
Interest Rate
6.04%
Mortgage Type
Purchase Money Mortgage
Create a Home Valuation Report for This Property
The Home Valuation Report is an in-depth analysis detailing your home's value as well as a comparison with similar homes in the area
Home Values in the Area
Average Home Value in this Area
Purchase History
| Date | Buyer | Sale Price | Title Company |
|---|---|---|---|
| Mortgage Guaranty Inc | -- | -- | |
| Federal National Mortgage Association | $99,000 | -- | |
| Filiault Rosann M | $119,000 | -- | |
| White Patrick I | $147,000 | -- | |
| Federal National Mortgage Association | $99,000 | -- | |
| Filiault Rosann M | $119,000 | -- |
Source: Public Records
Mortgage History
| Date | Status | Borrower | Loan Amount |
|---|---|---|---|
| Open | Filiault Rosann M | $100,000 | |
| Previous Owner | Filiault Rosann M | $107,100 |
Source: Public Records
Tax History Compared to Growth
Tax History
| Year | Tax Paid | Tax Assessment Tax Assessment Total Assessment is a certain percentage of the fair market value that is determined by local assessors to be the total taxable value of land and additions on the property. | Land | Improvement |
|---|---|---|---|---|
| 2025 | $3,740 | $238,500 | $52,000 | $186,500 |
| 2024 | $3,784 | $235,600 | $52,000 | $183,600 |
| 2023 | $3,505 | $205,600 | $49,500 | $156,100 |
| 2022 | $3,403 | $180,800 | $49,500 | $131,300 |
| 2021 | $3,060 | $161,900 | $45,000 | $116,900 |
| 2020 | $2,965 | $151,800 | $45,000 | $106,800 |
| 2019 | $2,757 | $140,100 | $45,000 | $95,100 |
| 2018 | $2,714 | $137,900 | $45,000 | $92,900 |
| 2017 | $2,721 | $138,400 | $44,900 | $93,500 |
| 2016 | $2,664 | $135,500 | $44,900 | $90,600 |
| 2015 | $2,577 | $131,000 | $44,900 | $86,100 |
Source: Public Records
Map
Nearby Homes