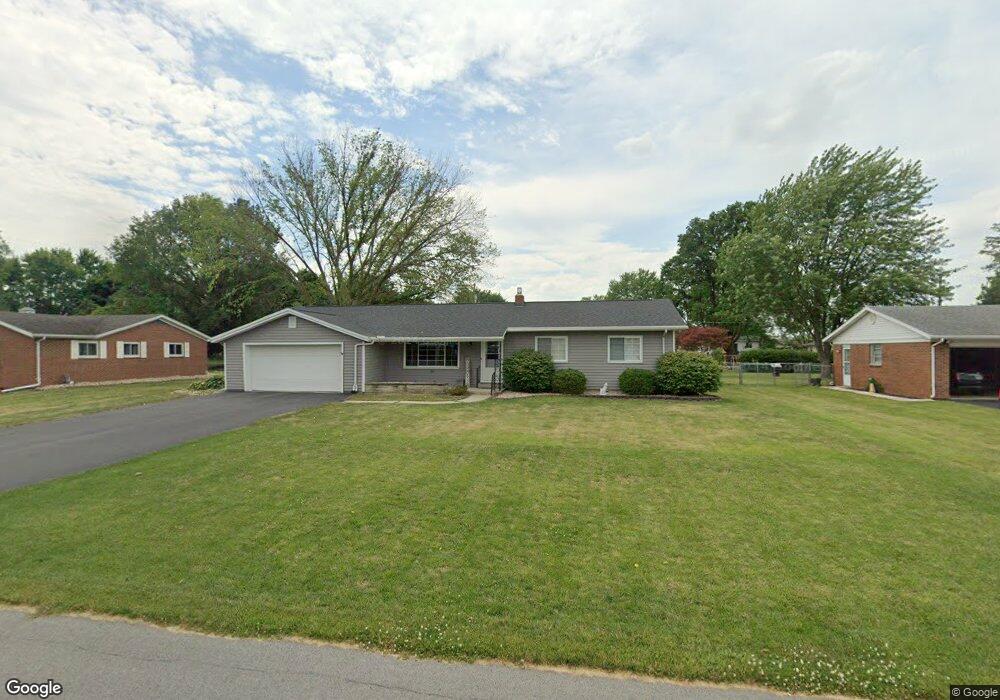
45 Pinewood Dr Tiffin, OH 44883
Estimated Value: $198,000 - $226,000
3
Beds
2
Baths
1,460
Sq Ft
$146/Sq Ft
Est. Value
About This Home
This home is located at 45 Pinewood Dr, Tiffin, OH 44883 and is currently estimated at $213,518, approximately $146 per square foot. 45 Pinewood Dr is a home located in Seneca County with nearby schools including Columbian High School, North Central Academy - Fremont, and Calvert Catholic Elementary School.
Ownership History
Date
Name
Owned For
Owner Type
Purchase Details
Closed on
Sep 16, 2022
Sold by
Bell James E and Bell Rebecca L
Bought by
Dayton Gary L
Current Estimated Value
Home Financials for this Owner
Home Financials are based on the most recent Mortgage that was taken out on this home.
Original Mortgage
$222,740
Outstanding Balance
$212,751
Interest Rate
5.22%
Mortgage Type
VA
Estimated Equity
$767
Purchase Details
Closed on
May 24, 2007
Sold by
K L Bish Properties Llc
Bought by
Bell James E and Bell Rebecca L
Home Financials for this Owner
Home Financials are based on the most recent Mortgage that was taken out on this home.
Original Mortgage
$122,000
Interest Rate
6.21%
Mortgage Type
New Conventional
Purchase Details
Closed on
Jan 25, 2006
Sold by
Bump Ruth M
Bought by
Lupton Marjorie A
Create a Home Valuation Report for This Property
The Home Valuation Report is an in-depth analysis detailing your home's value as well as a comparison with similar homes in the area
Home Values in the Area
Average Home Value in this Area
Purchase History
| Date | Buyer | Sale Price | Title Company |
|---|---|---|---|
| Dayton Gary L | $215,000 | -- | |
| Dayton Gary L | $215,000 | None Listed On Document | |
| Bell James E | $122,600 | None Available | |
| Lupton Marjorie A | -- | None Available |
Source: Public Records
Mortgage History
| Date | Status | Borrower | Loan Amount |
|---|---|---|---|
| Open | Dayton Gary L | $222,740 | |
| Closed | Dayton Gary L | $222,740 | |
| Previous Owner | Bell James E | $122,000 |
Source: Public Records
Tax History Compared to Growth
Tax History
| Year | Tax Paid | Tax Assessment Tax Assessment Total Assessment is a certain percentage of the fair market value that is determined by local assessors to be the total taxable value of land and additions on the property. | Land | Improvement |
|---|---|---|---|---|
| 2024 | $1,870 | $55,410 | $8,980 | $46,430 |
| 2023 | $1,872 | $55,410 | $8,980 | $46,430 |
| 2022 | $1,734 | $42,610 | $7,480 | $35,130 |
| 2021 | $1,747 | $42,610 | $7,480 | $35,130 |
| 2020 | $1,780 | $42,609 | $7,483 | $35,126 |
| 2019 | $1,726 | $39,981 | $7,182 | $32,799 |
| 2018 | $1,730 | $39,981 | $7,182 | $32,799 |
| 2017 | $1,805 | $39,981 | $7,182 | $32,799 |
| 2016 | $1,701 | $35,697 | $6,230 | $29,467 |
| 2015 | $1,684 | $35,697 | $6,230 | $29,467 |
| 2014 | $1,596 | $35,697 | $6,230 | $29,467 |
| 2013 | $1,695 | $36,800 | $6,423 | $30,377 |
Source: Public Records
Map
Nearby Homes
- 0 W Market St
- 169 Nelson St
- 0 Township Road 198a Unit 20242098
- 0 Township Road 198a Unit 6116514
- 0 Shaffer Park Dr Unit 20251435
- 115 Lindsay Ave
- 0 Miami St Unit 20242078
- 0 Miami St Unit 6116475
- 29 Virginia Ave
- 0 County Road 54 Unit 20242258
- 0 County Road 54 Unit 225023228
- 314 S Sandusky St
- 2695 Ohio 18
- 28 Orange St
- 17 Franklin St
- 841 S Sandusky St
- 215 Hudson St
- 190 Hall St
- 50 Clay St
- 48 Clay St