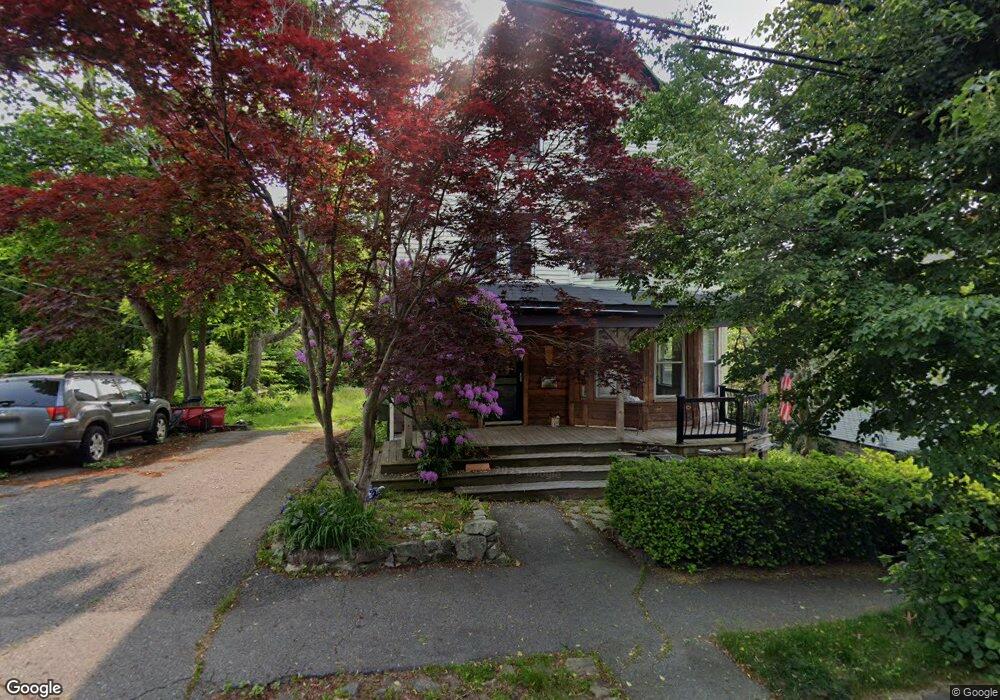
45 Pleasant St Swampscott, MA 01907
Estimated Value: $775,000 - $926,000
4
Beds
2
Baths
2,691
Sq Ft
$305/Sq Ft
Est. Value
About This Home
This home is located at 45 Pleasant St, Swampscott, MA 01907 and is currently estimated at $821,474, approximately $305 per square foot. 45 Pleasant St is a home located in Essex County with nearby schools including Swampscott Middle School and Swampscott High School.
Ownership History
Date
Name
Owned For
Owner Type
Purchase Details
Closed on
Oct 11, 2024
Sold by
St Laurent Richard W Est and Balboni
Bought by
Eagles Nest Inv Group Llc
Current Estimated Value
Home Financials for this Owner
Home Financials are based on the most recent Mortgage that was taken out on this home.
Original Mortgage
$750,000
Outstanding Balance
$740,632
Interest Rate
6.35%
Mortgage Type
Purchase Money Mortgage
Estimated Equity
$80,842
Purchase Details
Closed on
May 14, 2010
Sold by
Michael S Porter T
Bought by
Porter Leah C
Home Financials for this Owner
Home Financials are based on the most recent Mortgage that was taken out on this home.
Original Mortgage
$306,750
Interest Rate
4.25%
Mortgage Type
FHA
Purchase Details
Closed on
Aug 7, 2008
Sold by
Porter Leah C
Bought by
Stlaurent Richard W
Purchase Details
Closed on
Aug 5, 1999
Sold by
Sullivan John D and Sullivan Holly G
Bought by
Porter Michael S
Purchase Details
Closed on
Jul 15, 1994
Sold by
Kelliher Colin E and Kelliher Adrienne
Bought by
Sullivan John D and Getzen Holly G
Create a Home Valuation Report for This Property
The Home Valuation Report is an in-depth analysis detailing your home's value as well as a comparison with similar homes in the area
Home Values in the Area
Average Home Value in this Area
Purchase History
| Date | Buyer | Sale Price | Title Company |
|---|---|---|---|
| Eagles Nest Inv Group Llc | $750,000 | None Available | |
| Eagles Nest Inv Group Llc | $750,000 | None Available | |
| Eagles Nest Inv Group Llc | $750,000 | None Available | |
| Eagles Nest Inv Group Llc | $750,000 | None Available | |
| Porter Leah C | -- | -- | |
| Porter Leah C | -- | -- | |
| Stlaurent Richard W | -- | -- | |
| Stlaurent Richard W | -- | -- | |
| Porter Michael S | $292,500 | -- | |
| Porter Michael S | $292,500 | -- | |
| Sullivan John D | $198,000 | -- | |
| Sullivan John D | $198,000 | -- |
Source: Public Records
Mortgage History
| Date | Status | Borrower | Loan Amount |
|---|---|---|---|
| Open | Eagles Nest Inv Group Llc | $750,000 | |
| Closed | Eagles Nest Inv Group Llc | $750,000 | |
| Previous Owner | Sullivan John D | $306,750 | |
| Previous Owner | Sullivan John D | $30,000 |
Source: Public Records
Tax History Compared to Growth
Tax History
| Year | Tax Paid | Tax Assessment Tax Assessment Total Assessment is a certain percentage of the fair market value that is determined by local assessors to be the total taxable value of land and additions on the property. | Land | Improvement |
|---|---|---|---|---|
| 2025 | $9,379 | $817,700 | $356,800 | $460,900 |
| 2024 | $9,190 | $799,800 | $340,800 | $459,000 |
| 2023 | $8,886 | $756,900 | $308,800 | $448,100 |
| 2022 | $8,871 | $691,400 | $266,200 | $425,200 |
| 2021 | $8,746 | $633,800 | $244,900 | $388,900 |
| 2020 | $7,912 | $553,300 | $213,000 | $340,300 |
| 2019 | $7,396 | $486,600 | $170,400 | $316,200 |
| 2018 | $7,251 | $453,200 | $149,100 | $304,100 |
| 2017 | $7,148 | $409,600 | $149,100 | $260,500 |
| 2016 | $6,705 | $386,900 | $138,400 | $248,500 |
| 2015 | $6,544 | $381,600 | $133,100 | $248,500 |
| 2014 | $6,276 | $335,600 | $111,800 | $223,800 |
Source: Public Records
Map
Nearby Homes
- 8 Ocean View Rd
- 21 Bay View Dr
- 35 Alden Rd
- 71 Walnut Rd
- 75 Bay View Dr
- 13 Cedar Hill Terrace Unit 2
- 24 Orchard Cir
- 71 Greenwood Ave Unit 207
- 110 Galloupes Point Rd
- 309 Paradise Rd
- 35 Littles Point Rd Unit S201
- 306 Paradise Rd
- 25 Manton Rd
- 37 Stanley Rd
- 98 Paradise Rd
- 51 Barnstable St
- 10-12 Fairview Ave
- 1004 Paradise Rd Unit PHJ
- 445 Essex St Unit 304
- 2 Gracie Ln Unit 4