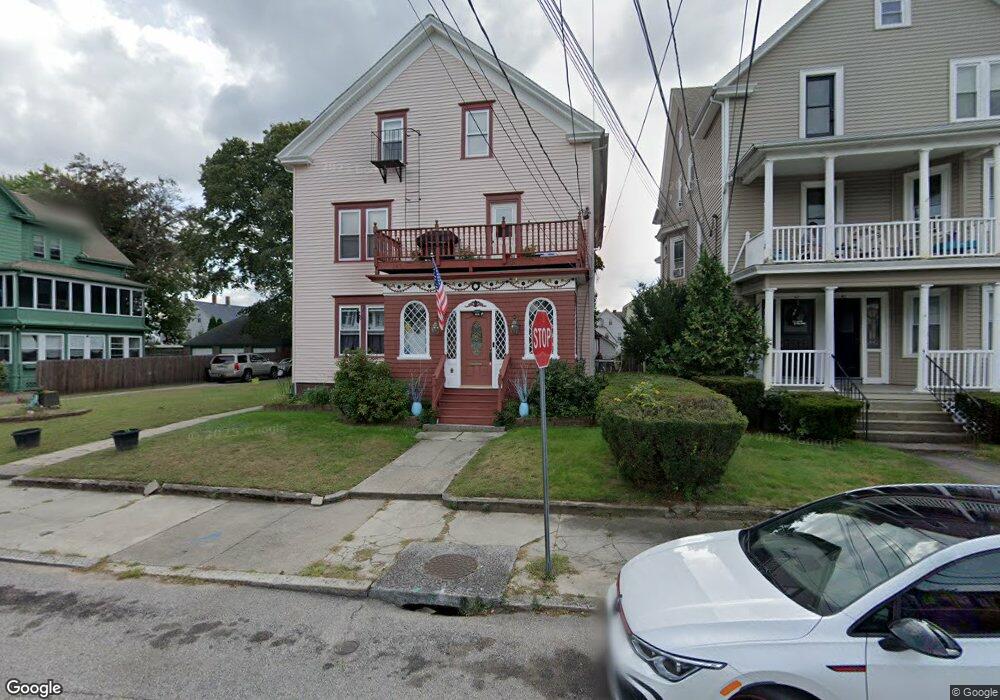
45 Potter St Pawtucket, RI 02860
Quality Hill NeighborhoodEstimated Value: $614,004 - $772,000
8
Beds
2
Baths
4,226
Sq Ft
$162/Sq Ft
Est. Value
About This Home
This home is located at 45 Potter St, Pawtucket, RI 02860 and is currently estimated at $684,751, approximately $162 per square foot. 45 Potter St is a home located in Providence County with nearby schools including Times Squared Academy, Times2 Middle/High School, and Saint Teresa Catholic Elementary School.
Ownership History
Date
Name
Owned For
Owner Type
Purchase Details
Closed on
Jan 10, 1994
Sold by
Oreilly John J and Kelly Elizabeth
Bought by
Hardy Daniel S and Hardy Natalia
Current Estimated Value
Home Financials for this Owner
Home Financials are based on the most recent Mortgage that was taken out on this home.
Original Mortgage
$115,411
Interest Rate
7.23%
Create a Home Valuation Report for This Property
The Home Valuation Report is an in-depth analysis detailing your home's value as well as a comparison with similar homes in the area
Home Values in the Area
Average Home Value in this Area
Purchase History
| Date | Buyer | Sale Price | Title Company |
|---|---|---|---|
| Hardy Daniel S | $111,000 | -- |
Source: Public Records
Mortgage History
| Date | Status | Borrower | Loan Amount |
|---|---|---|---|
| Closed | Hardy Daniel S | $115,411 |
Source: Public Records
Tax History Compared to Growth
Tax History
| Year | Tax Paid | Tax Assessment Tax Assessment Total Assessment is a certain percentage of the fair market value that is determined by local assessors to be the total taxable value of land and additions on the property. | Land | Improvement |
|---|---|---|---|---|
| 2025 | $7,528 | $572,500 | $116,000 | $456,500 |
| 2024 | $7,065 | $572,500 | $116,000 | $456,500 |
| 2023 | $6,586 | $388,800 | $67,200 | $321,600 |
| 2022 | $6,446 | $388,800 | $67,200 | $321,600 |
| 2021 | $6,446 | $388,800 | $67,200 | $321,600 |
| 2020 | $5,596 | $267,900 | $56,000 | $211,900 |
| 2019 | $5,596 | $267,900 | $56,000 | $211,900 |
| 2018 | $5,393 | $267,900 | $56,000 | $211,900 |
| 2017 | $5,355 | $235,700 | $47,700 | $188,000 |
| 2016 | $5,159 | $235,700 | $47,700 | $188,000 |
| 2015 | $5,159 | $235,700 | $47,700 | $188,000 |
| 2014 | $5,048 | $218,900 | $47,700 | $171,200 |
Source: Public Records
Map
Nearby Homes