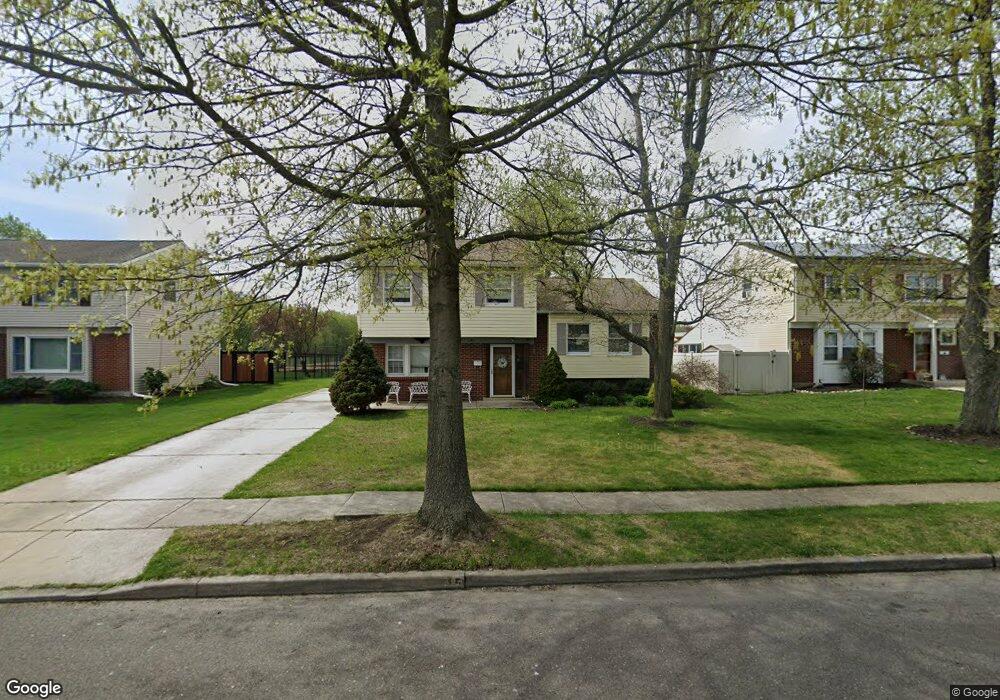
45 Radnor Blvd Marlton, NJ 08053
Estimated Value: $361,000 - $437,000
--
Bed
--
Bath
1,785
Sq Ft
$222/Sq Ft
Est. Value
About This Home
This home is located at 45 Radnor Blvd, Marlton, NJ 08053 and is currently estimated at $396,407, approximately $222 per square foot. 45 Radnor Blvd is a home located in Burlington County with nearby schools including H.L. Beeler Elementary School, Marlton Middle School, and Cherokee High School.
Ownership History
Date
Name
Owned For
Owner Type
Purchase Details
Closed on
Aug 30, 2023
Sold by
Burch Karol C
Bought by
Burch Kyle
Current Estimated Value
Home Financials for this Owner
Home Financials are based on the most recent Mortgage that was taken out on this home.
Original Mortgage
$192,000
Outstanding Balance
$187,789
Interest Rate
6.78%
Mortgage Type
New Conventional
Estimated Equity
$208,618
Purchase Details
Closed on
Feb 21, 1962
Bought by
Gollihue Harry E and Gollihue Pauline A
Create a Home Valuation Report for This Property
The Home Valuation Report is an in-depth analysis detailing your home's value as well as a comparison with similar homes in the area
Home Values in the Area
Average Home Value in this Area
Purchase History
| Date | Buyer | Sale Price | Title Company |
|---|---|---|---|
| Burch Kyle | $240,000 | Emerald Title | |
| Gollihue Harry E | -- | -- |
Source: Public Records
Mortgage History
| Date | Status | Borrower | Loan Amount |
|---|---|---|---|
| Open | Burch Kyle | $192,000 |
Source: Public Records
Tax History Compared to Growth
Tax History
| Year | Tax Paid | Tax Assessment Tax Assessment Total Assessment is a certain percentage of the fair market value that is determined by local assessors to be the total taxable value of land and additions on the property. | Land | Improvement |
|---|---|---|---|---|
| 2025 | $7,547 | $221,000 | $115,000 | $106,000 |
| 2024 | $7,101 | $221,000 | $115,000 | $106,000 |
| 2023 | $7,101 | $221,000 | $115,000 | $106,000 |
| 2022 | $6,782 | $221,000 | $115,000 | $106,000 |
| 2021 | $5,885 | $221,000 | $115,000 | $106,000 |
| 2020 | $6,537 | $221,000 | $115,000 | $106,000 |
| 2019 | $6,484 | $221,000 | $115,000 | $106,000 |
| 2018 | $6,394 | $221,000 | $115,000 | $106,000 |
| 2017 | $6,068 | $221,000 | $115,000 | $106,000 |
| 2016 | $5,914 | $221,000 | $115,000 | $106,000 |
| 2015 | $5,805 | $221,000 | $115,000 | $106,000 |
| 2014 | $5,633 | $221,000 | $115,000 | $106,000 |
Source: Public Records
Map
Nearby Homes