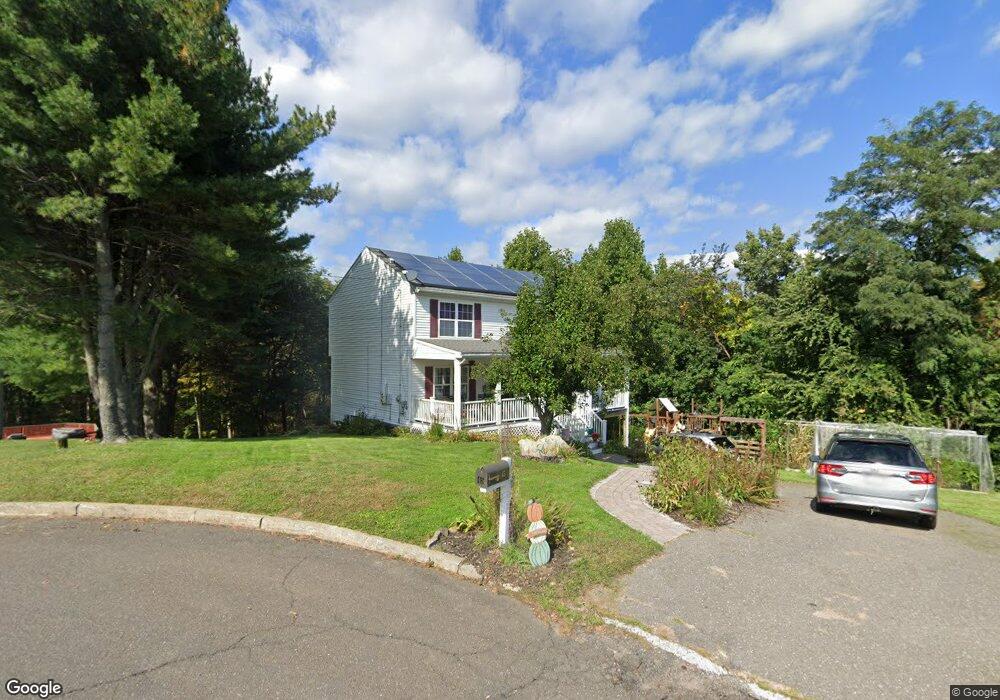
45 Rayron Cir Naugatuck, CT 06770
Estimated Value: $399,285 - $497,000
3
Beds
3
Baths
1,700
Sq Ft
$263/Sq Ft
Est. Value
About This Home
This home is located at 45 Rayron Cir, Naugatuck, CT 06770 and is currently estimated at $447,071, approximately $262 per square foot. 45 Rayron Cir is a home located in New Haven County with nearby schools including City Hill Middle School and Naugatuck High School.
Ownership History
Date
Name
Owned For
Owner Type
Purchase Details
Closed on
May 28, 2009
Sold by
Fnma
Bought by
Fretz Kevin and Fretz Jackie
Current Estimated Value
Purchase Details
Closed on
Jan 30, 1998
Sold by
Pine Hill Dev
Bought by
Stecenko Victor and Stecenko Andrea
Create a Home Valuation Report for This Property
The Home Valuation Report is an in-depth analysis detailing your home's value as well as a comparison with similar homes in the area
Home Values in the Area
Average Home Value in this Area
Purchase History
| Date | Buyer | Sale Price | Title Company |
|---|---|---|---|
| Fretz Kevin | $182,000 | -- | |
| Stecenko Victor | $125,900 | -- |
Source: Public Records
Mortgage History
| Date | Status | Borrower | Loan Amount |
|---|---|---|---|
| Open | Stecenko Victor | $162,000 | |
| Closed | Stecenko Victor | $10,000 | |
| Closed | Stecenko Victor | $10,000 |
Source: Public Records
Tax History
| Year | Tax Paid | Tax Assessment Tax Assessment Total Assessment is a certain percentage of the fair market value that is determined by local assessors to be the total taxable value of land and additions on the property. | Land | Improvement |
|---|---|---|---|---|
| 2025 | $8,008 | $201,250 | $33,320 | $167,930 |
| 2024 | $8,410 | $201,250 | $33,320 | $167,930 |
| 2023 | $9,006 | $201,250 | $33,320 | $167,930 |
| 2022 | $6,426 | $134,570 | $35,480 | $99,090 |
| 2021 | $6,426 | $134,570 | $35,480 | $99,090 |
| 2020 | $6,426 | $134,570 | $35,480 | $99,090 |
| 2019 | $6,358 | $134,570 | $35,480 | $99,090 |
| 2018 | $6,401 | $132,390 | $45,370 | $87,020 |
| 2017 | $6,306 | $129,880 | $45,370 | $84,510 |
| 2016 | $6,191 | $129,880 | $45,370 | $84,510 |
| 2015 | $5,919 | $129,880 | $45,370 | $84,510 |
| 2014 | $5,852 | $129,880 | $45,370 | $84,510 |
| 2012 | $5,901 | $175,880 | $54,140 | $121,740 |
Source: Public Records
Map
Nearby Homes
- 46 Mulberry St
- 137 Lincoln St
- 36 Longview Terrace
- 85 Cold Spring Cir
- 51 Brook St Unit 6A
- 51 Brook St Unit 3B
- 89 Alma St
- 111 Wooster St Unit 4A
- 25 Tyler Hill Rd
- 190 Auburn St
- 18 Cadbury Place
- 121 Johnson St
- 163 City Hill St
- 210 Johnson St
- 130 Celentano Dr
- 3 Maple Terrace
- 231 N Main St
- 825 Maple Hill Rd
- 32 Stanley St
- 53 High St
Your Personal Tour Guide
Ask me questions while you tour the home.