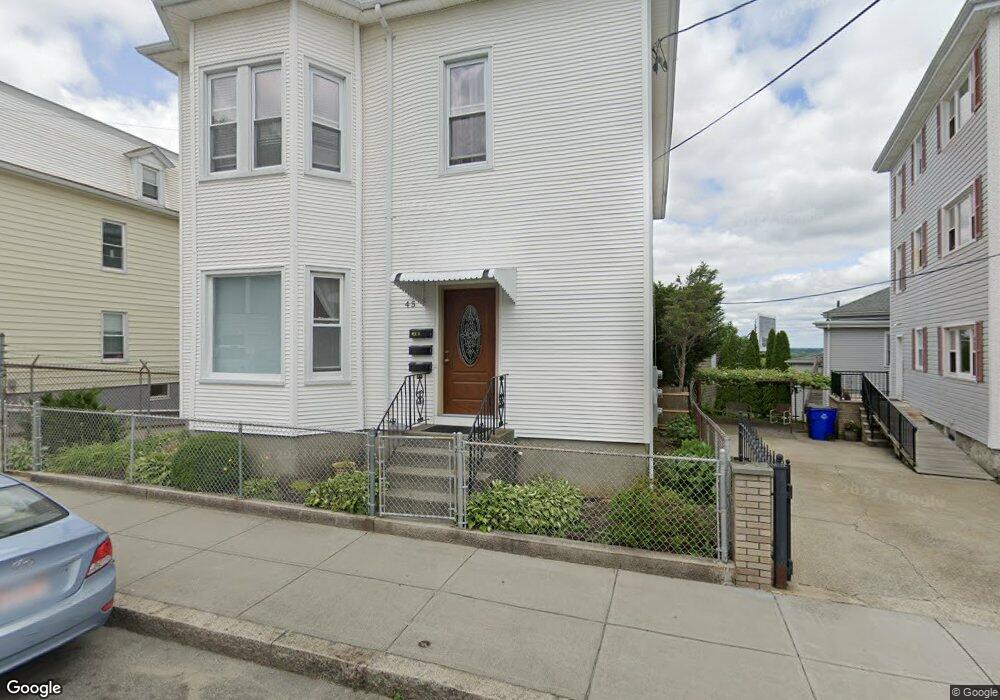
45 Ridge St Fall River, MA 02721
Corky Row NeighborhoodEstimated Value: $662,000 - $697,000
6
Beds
3
Baths
4,350
Sq Ft
$156/Sq Ft
Est. Value
About This Home
This home is located at 45 Ridge St, Fall River, MA 02721 and is currently estimated at $680,667, approximately $156 per square foot. 45 Ridge St is a home located in Bristol County with nearby schools including Henry Lord Community School, B M C Durfee High School, and Argosy Collegiate Charter School.
Ownership History
Date
Name
Owned For
Owner Type
Purchase Details
Closed on
Jun 15, 2023
Sold by
Zenaida Lopes Irt and Felix
Bought by
Felix Filomena
Current Estimated Value
Purchase Details
Closed on
Oct 26, 2012
Sold by
Lopes Zenaida
Bought by
Zenaida Lopes Irt and Lopes
Purchase Details
Closed on
Mar 28, 2012
Sold by
Lopes Gualter M and Lopes Zenaida
Bought by
Lopes Zenaida
Create a Home Valuation Report for This Property
The Home Valuation Report is an in-depth analysis detailing your home's value as well as a comparison with similar homes in the area
Home Values in the Area
Average Home Value in this Area
Purchase History
| Date | Buyer | Sale Price | Title Company |
|---|---|---|---|
| Felix Filomena | -- | None Available | |
| Zenaida Lopes Irt | -- | -- | |
| Lopes Zenaida | -- | -- |
Source: Public Records
Mortgage History
| Date | Status | Borrower | Loan Amount |
|---|---|---|---|
| Previous Owner | Lopes Zenaida | $8,000 | |
| Previous Owner | Lopes Zenaida | $17,000 |
Source: Public Records
Tax History Compared to Growth
Tax History
| Year | Tax Paid | Tax Assessment Tax Assessment Total Assessment is a certain percentage of the fair market value that is determined by local assessors to be the total taxable value of land and additions on the property. | Land | Improvement |
|---|---|---|---|---|
| 2025 | $6,619 | $578,100 | $105,400 | $472,700 |
| 2024 | $6,325 | $550,500 | $101,500 | $449,000 |
| 2023 | $5,573 | $454,200 | $83,900 | $370,300 |
| 2022 | $4,913 | $389,300 | $79,900 | $309,400 |
| 2021 | $4,610 | $333,300 | $76,000 | $257,300 |
| 2020 | $4,097 | $283,500 | $74,900 | $208,600 |
| 2019 | $3,447 | $236,400 | $72,100 | $164,300 |
| 2018 | $3,228 | $220,800 | $78,100 | $142,700 |
| 2017 | $3,039 | $217,100 | $74,400 | $142,700 |
| 2016 | $2,973 | $218,100 | $79,200 | $138,900 |
| 2015 | $2,853 | $218,100 | $79,200 | $138,900 |
| 2014 | $2,891 | $229,800 | $76,900 | $152,900 |
Source: Public Records
Map
Nearby Homes