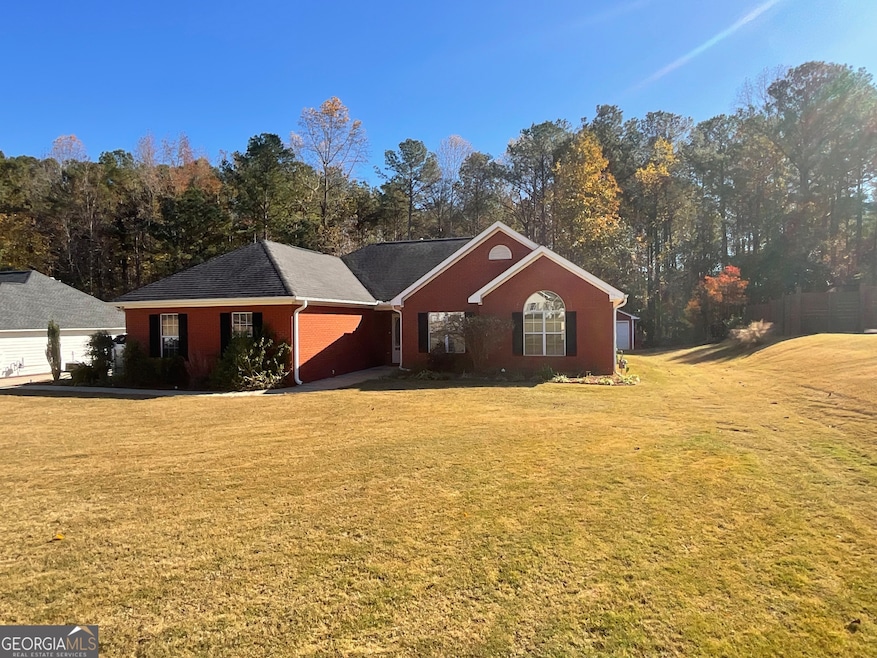
45 Riverside Walk Sharpsburg, GA 30277
Estimated payment $2,271/month
Highlights
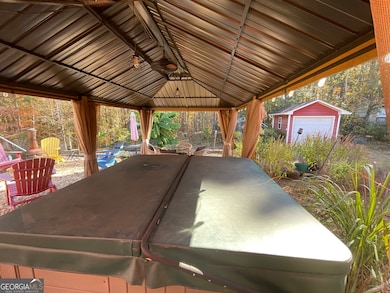
- Spa
- Vaulted Ceiling
- Great Room
- Lee Middle School Rated A-
- Ranch Style House
- No HOA
About This Home
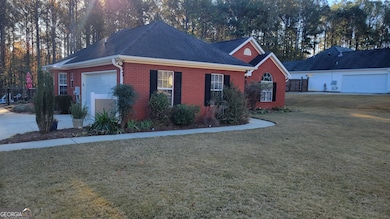
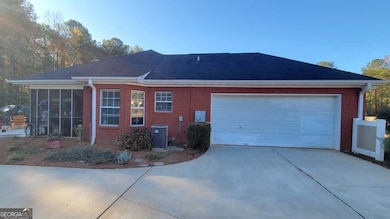
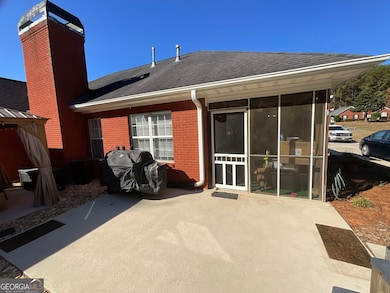
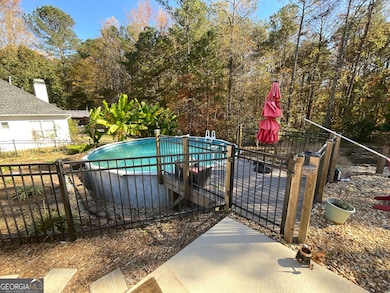
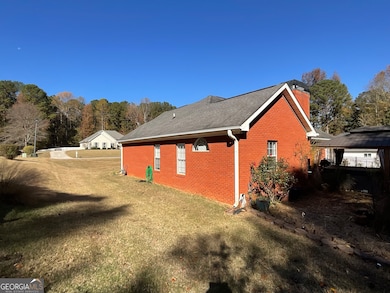
Welcome to this charming 4-sided brick ranch offering 3 bedrooms and 2 full baths on a peaceful, private lot. Perfect for relaxation and entertaining, the backyard features an oversized gazebo, jacuzzi, and sparkling pool-plus a 10x12 storage shed for added convenience. Enjoy morning coffee or evening sunsets from the screened-in back patio just off the kitchen, overlooking the pool area. Inside, you'll find a spacious family room with a vaulted ceiling and cozy fireplace, a bright kitchen with a breakfast area, and a separate dining room ideal for gatherings. The home also includes a double-car garage and a large parking pad, along with beautifully updated luxury vinyl plank flooring throughout the main living areas. Come see this inviting home that perfectly combines comfort, style, and outdoor enjoyment!
Home Details
Home Type
- Single Family
Est. Annual Taxes
- $2,887
Year Built
- Built in 2000
Lot Details
- 0.8 Acre Lot
- Kennel or Dog Run
- Level Lot
Home Design
- Ranch Style House
- Slab Foundation
- Composition Roof
- Four Sided Brick Exterior Elevation
Interior Spaces
- 1,568 Sq Ft Home
- Tray Ceiling
- Vaulted Ceiling
- Factory Built Fireplace
- Great Room
- Formal Dining Room
Kitchen
- Breakfast Area or Nook
- Breakfast Bar
- Oven or Range
- Microwave
- Ice Maker
- Dishwasher
Flooring
- Carpet
- Vinyl
Bedrooms and Bathrooms
- 3 Main Level Bedrooms
- Walk-In Closet
- 2 Full Bathrooms
- Double Vanity
- Soaking Tub
- Separate Shower
Laundry
- Laundry Room
- Laundry in Kitchen
Parking
- Garage
- Parking Pad
- Parking Accessed On Kitchen Level
- Side or Rear Entrance to Parking
- Garage Door Opener
Accessible Home Design
- Accessible Entrance
Pool
- Spa
- Above Ground Pool
Outdoor Features
- Gazebo
- Shed
Schools
- Welch Elementary School
- Lee Middle School
- East Coweta High School
Utilities
- Central Air
- Heating System Uses Natural Gas
- Underground Utilities
- Gas Water Heater
- Septic Tank
- High Speed Internet
- Cable TV Available
Community Details
- No Home Owners Association
- Riverside Subdivision
Listing and Financial Details
- Legal Lot and Block 70 / C
Map
Home Values in the Area
Average Home Value in this Area
Tax History
| Year | Tax Paid | Tax Assessment Tax Assessment Total Assessment is a certain percentage of the fair market value that is determined by local assessors to be the total taxable value of land and additions on the property. | Land | Improvement |
|---|---|---|---|---|
| 2025 | $1,686 | $131,360 | $26,000 | $105,360 |
| 2024 | $1,889 | $124,470 | $26,000 | $98,470 |
| 2023 | $1,889 | $125,082 | $20,000 | $105,082 |
| 2022 | $2,614 | $106,125 | $20,000 | $86,125 |
| 2021 | $2,256 | $85,713 | $16,000 | $69,713 |
| 2020 | $698 | $85,713 | $16,000 | $69,713 |
| 2019 | $639 | $69,482 | $10,000 | $59,482 |
| 2018 | $643 | $69,482 | $10,000 | $59,482 |
| 2017 | $582 | $63,901 | $10,000 | $53,901 |
| 2016 | $563 | $63,901 | $10,000 | $53,901 |
| 2015 | $450 | $55,314 | $10,000 | $45,314 |
| 2014 | $435 | $55,314 | $10,000 | $45,314 |
Property History
| Date | Event | Price | List to Sale | Price per Sq Ft |
|---|---|---|---|---|
| 11/13/2025 11/13/25 | For Sale | $385,900 | -- | $246 / Sq Ft |
Purchase History
| Date | Type | Sale Price | Title Company |
|---|---|---|---|
| Trustee Deed | -- | -- | |
| Warranty Deed | -- | -- | |
| Warranty Deed | -- | -- | |
| Quit Claim Deed | -- | -- | |
| Deed | $144,500 | -- | |
| Deed | -- | -- | |
| Deed | -- | -- | |
| Deed | $27,300 | -- | |
| Deed | $1,156,200 | -- |
Source: Georgia MLS
MLS Number: 10642971
APN: 123-6033-154
Disclaimer: Certain information contained herein is derived from information provided by parties other than Homes.com. All information provided is deemed reliable, but is not guaranteed to be accurate and should be independently verified.
![]() The data relating to real estate for sale on this web site comes in part from the Broker Reciprocity Program of Georgia MLS. Real estate listings held by brokerage firms other than Redfin are marked with the Broker Reciprocity logo and detailed information about them includes the name of the listing brokers. Information deemed reliable but not guaranteed. Copyright 2025 Georgia MLS. All rights reserved.
The data relating to real estate for sale on this web site comes in part from the Broker Reciprocity Program of Georgia MLS. Real estate listings held by brokerage firms other than Redfin are marked with the Broker Reciprocity logo and detailed information about them includes the name of the listing brokers. Information deemed reliable but not guaranteed. Copyright 2025 Georgia MLS. All rights reserved.
- 955 Parks Rd
- 11 Masters Way
- Camden Plan at Candleberry Place
- Savannah Plan at Candleberry Place
- Briarwood Plan at Candleberry Place
- Newport Plan at Candleberry Place
- 9 Candleberry Way
- at Candleberry Place
- 75 Olympia Dr
- 41 Masters Dr
- 185 Cold Harbor Ct
- 270 Sturgess Run
- 80 Vineyards Dr
- 131 Pecan Lake Dr
- 32 Marvin Gardens
- 75 Pacific Ave
- 9 Marvin Gardens
- 20 Mayhaw Point
- 24 Marvin Gardens
- 32 Mayhaw Point
- 60 Riverside Pkwy Unit 1
- 60 Vineyards Dr
- 42 Kentucky Ave
- 41 St Charles Place
- 67 Kentucky Ave
- 162 Ashton Place
- 66 Cottage Dr
- 15 Candlewood Ct
- 50 Brookview Dr
- 179 Scenic Hills Dr
- 110 Freeman Forest Dr
- 25 Elberta Dr
- 317 Prescott Ct
- 63 Dr
- 26 Fenway Ct
- 28 Sandstone Dr
- 440 Fairway Ct
- 385 Fairway Ct
- 45 Chemin Place
- 15 Stonewood Way
