Estimated Value: $417,000 - $511,000
4
Beds
1
Bath
1,111
Sq Ft
$423/Sq Ft
Est. Value
About This Home
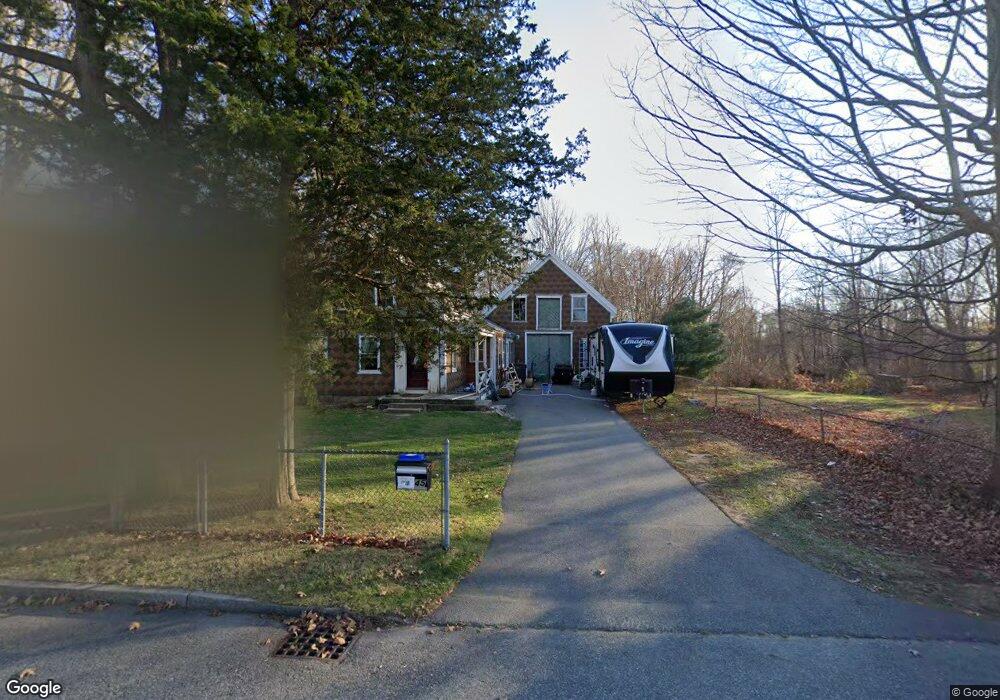
This home is located at 45 Robbins St, Avon, MA 02322 and is currently estimated at $470,428, approximately $423 per square foot. 45 Robbins St is a home located in Norfolk County with nearby schools including Ralph D. Butler Elementary School and Avon Middle/High School.
Ownership History
Date
Name
Owned For
Owner Type
Purchase Details
Closed on
Oct 30, 2009
Sold by
Lynch James C and Lynch John F
Bought by
Mcintyre James
Current Estimated Value
Home Financials for this Owner
Home Financials are based on the most recent Mortgage that was taken out on this home.
Original Mortgage
$142,000
Outstanding Balance
$93,004
Interest Rate
5.06%
Mortgage Type
Purchase Money Mortgage
Estimated Equity
$377,424
Purchase Details
Closed on
May 8, 2006
Sold by
Lynch Charles L
Bought by
Lynch John F and Lynch James C
Create a Home Valuation Report for This Property
The Home Valuation Report is an in-depth analysis detailing your home's value as well as a comparison with similar homes in the area
Home Values in the Area
Average Home Value in this Area
Purchase History
| Date | Buyer | Sale Price | Title Company |
|---|---|---|---|
| Mcintyre James | $177,500 | -- | |
| Lynch John F | -- | -- |
Source: Public Records
Mortgage History
| Date | Status | Borrower | Loan Amount |
|---|---|---|---|
| Open | Mcintyre James | $142,000 |
Source: Public Records
Tax History
| Year | Tax Paid | Tax Assessment Tax Assessment Total Assessment is a certain percentage of the fair market value that is determined by local assessors to be the total taxable value of land and additions on the property. | Land | Improvement |
|---|---|---|---|---|
| 2025 | $43 | $325,000 | $193,500 | $131,500 |
| 2024 | $4,163 | $296,700 | $183,400 | $113,300 |
| 2023 | $4,041 | $296,700 | $183,400 | $113,300 |
| 2022 | $4,013 | $253,800 | $153,000 | $100,800 |
| 2021 | $3,812 | $227,200 | $138,900 | $88,300 |
| 2020 | $3,935 | $222,300 | $136,200 | $86,100 |
| 2019 | $3,904 | $217,000 | $136,200 | $80,800 |
| 2018 | $4,025 | $217,000 | $136,200 | $80,800 |
| 2017 | $3,468 | $200,700 | $136,200 | $64,500 |
| 2016 | $3,456 | $202,000 | $136,200 | $65,800 |
| 2015 | $2,979 | $182,000 | $123,800 | $58,200 |
Source: Public Records
Map
Nearby Homes
Your Personal Tour Guide
Ask me questions while you tour the home.