45 S 100 E Fielding, UT 84311
Estimated Value: $428,000 - $545,000
3
Beds
2
Baths
2,518
Sq Ft
$187/Sq Ft
Est. Value
About This Home
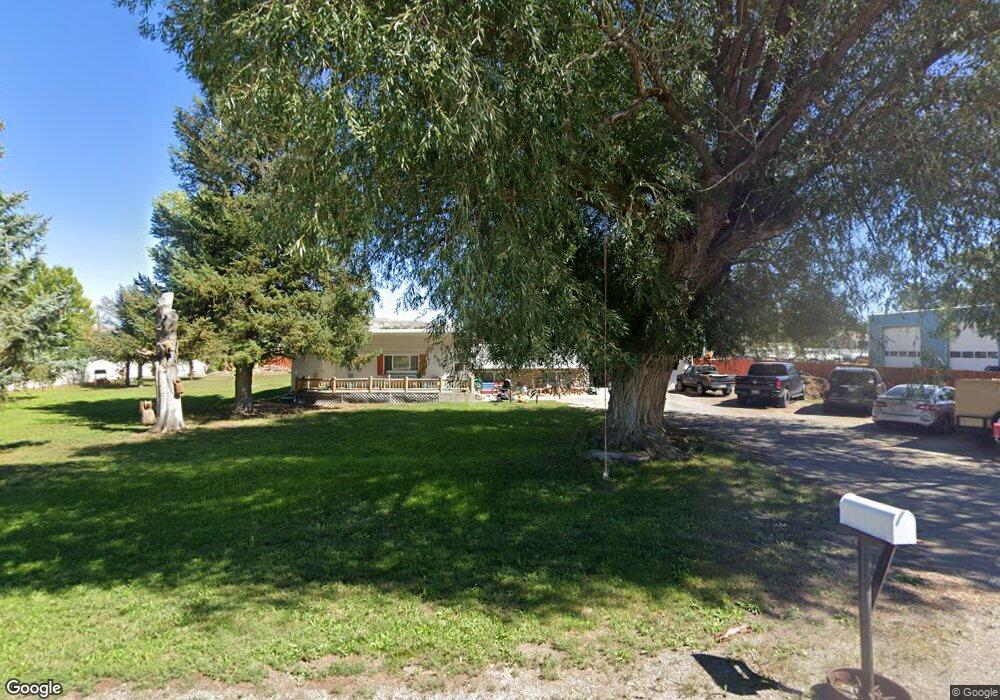
This home is located at 45 S 100 E, Fielding, UT 84311 and is currently estimated at $469,828, approximately $186 per square foot. 45 S 100 E is a home located in Box Elder County with nearby schools including Fielding School, Bear River Middle School, and Alice C. Harris Intermediate School.
Ownership History
Date
Name
Owned For
Owner Type
Purchase Details
Closed on
Aug 5, 2020
Sold by
Jorgensen Ethan and Jorgensen Savanna
Bought by
Padgham Scott
Current Estimated Value
Purchase Details
Closed on
Nov 19, 2019
Sold by
Pulver Clayton Paul
Bought by
Mckenna Morgan Rod
Home Financials for this Owner
Home Financials are based on the most recent Mortgage that was taken out on this home.
Original Mortgage
$190,000
Interest Rate
3.5%
Mortgage Type
New Conventional
Purchase Details
Closed on
Aug 29, 2017
Sold by
Jorgensen Ethan
Bought by
Jorgensen Ethan and Jorgensen Savanna
Home Financials for this Owner
Home Financials are based on the most recent Mortgage that was taken out on this home.
Original Mortgage
$237,272
Interest Rate
4.03%
Mortgage Type
New Conventional
Purchase Details
Closed on
Aug 28, 2017
Sold by
Nutt Robert L and Nutt Laura J
Bought by
Jorgensen Ethan
Home Financials for this Owner
Home Financials are based on the most recent Mortgage that was taken out on this home.
Original Mortgage
$237,272
Interest Rate
4.03%
Mortgage Type
New Conventional
Create a Home Valuation Report for This Property
The Home Valuation Report is an in-depth analysis detailing your home's value as well as a comparison with similar homes in the area
Purchase History
| Date | Buyer | Sale Price | Title Company |
|---|---|---|---|
| Padgham Scott | -- | Investors Title Ins Agcy Inc | |
| Mckenna Morgan Rod | -- | American Secure Ttl Tremonto | |
| Jorgensen Ethan | -- | Pinnacle Title | |
| Jorgensen Ethan | -- | American Secure Title Tremon |
Source: Public Records
Mortgage History
| Date | Status | Borrower | Loan Amount |
|---|---|---|---|
| Previous Owner | Mckenna Morgan Rod | $190,000 | |
| Previous Owner | Jorgensen Ethan | $237,272 |
Source: Public Records
Tax History
| Year | Tax Paid | Tax Assessment Tax Assessment Total Assessment is a certain percentage of the fair market value that is determined by local assessors to be the total taxable value of land and additions on the property. | Land | Improvement |
|---|---|---|---|---|
| 2025 | $2,191 | $419,536 | $130,000 | $289,536 |
| 2024 | $1,926 | $420,675 | $130,000 | $290,675 |
| 2023 | $1,994 | $440,398 | $130,000 | $310,398 |
| 2022 | $1,841 | $381,674 | $65,000 | $316,674 |
| 2021 | $1,552 | $279,853 | $30,000 | $249,853 |
| 2020 | $1,602 | $279,853 | $30,000 | $249,853 |
| 2019 | $1,428 | $131,016 | $16,500 | $114,516 |
| 2018 | $1,359 | $116,079 | $16,500 | $99,579 |
| 2017 | $1,079 | $161,873 | $16,500 | $131,873 |
| 2016 | $1,032 | $82,826 | $16,500 | $66,326 |
| 2015 | $871 | $71,051 | $16,500 | $54,551 |
| 2014 | $871 | $68,454 | $16,500 | $51,954 |
| 2013 | -- | $63,731 | $16,500 | $47,231 |
Source: Public Records
Map
Nearby Homes
- 95 E 100 S
- 303 S Center St
- 95 W 100 N
- 15920 N 4000 W Unit 14
- 16580 N 5200 W
- 18100 N 4400 W
- 18120 N 4400 W
- 18250 N 4400 W
- 5855 W 16800 N
- 15290 N 4950 W
- 5601 W 15200 N
- 4840 W 14400 N
- 18188 N 6000 W
- 16418 N Beaver Dam Rd
- 4881 W 14400 N
- 3536 W 14100 N
- 14296 N 5350 W
- 13275 N Brookside Dr Unit 12
- 19040 N Wendell Way
- 19188 N Wendell Way
Your Personal Tour Guide
Ask me questions while you tour the home.