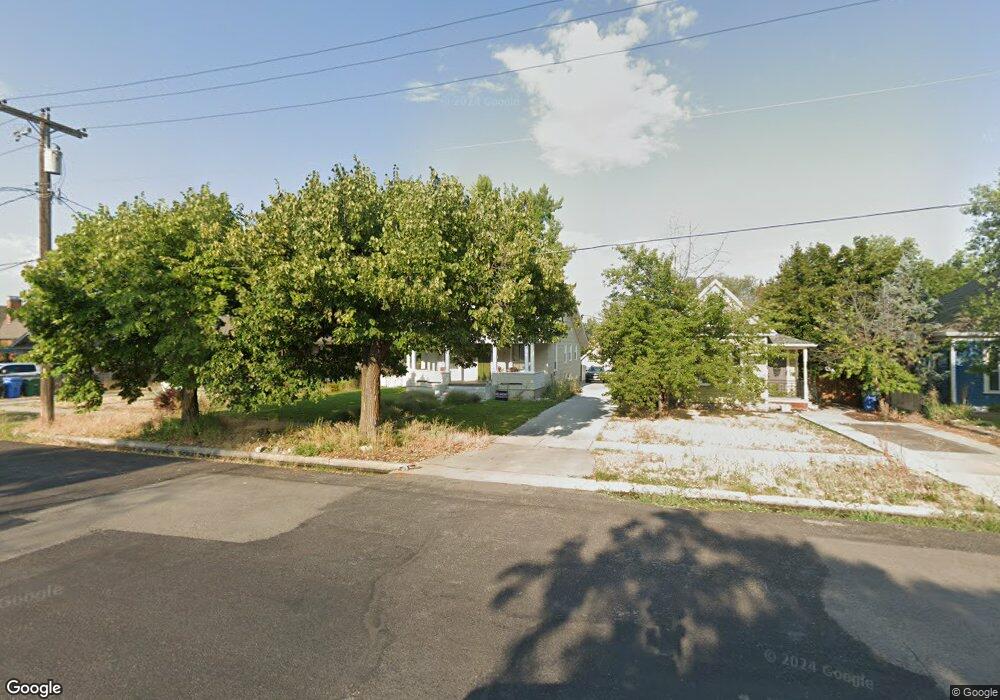
45 S 300 W Logan, UT 84321
Ellis NeighborhoodEstimated Value: $471,542 - $615,000
5
Beds
2
Baths
2,323
Sq Ft
$231/Sq Ft
Est. Value
About This Home
This home is located at 45 S 300 W, Logan, UT 84321 and is currently estimated at $536,386, approximately $230 per square foot. 45 S 300 W is a home located in Cache County with nearby schools including Ellis School, Mount Logan Middle School, and Logan High School.
Ownership History
Date
Name
Owned For
Owner Type
Purchase Details
Closed on
Jul 16, 2021
Sold by
Johnson Manuel S and Johnson Brittany L
Bought by
Johnson Brittany L
Current Estimated Value
Purchase Details
Closed on
Jul 25, 2013
Sold by
Mackinnon Peter D and Saunderson Lisa
Bought by
Johnson Manuel S and Johnson Brittany L
Home Financials for this Owner
Home Financials are based on the most recent Mortgage that was taken out on this home.
Original Mortgage
$220,924
Outstanding Balance
$161,841
Interest Rate
4.25%
Mortgage Type
FHA
Estimated Equity
$374,545
Purchase Details
Closed on
Dec 26, 2007
Sold by
Campbell Rex
Bought by
Mackinnon Peter D and Saunderson Lisa
Home Financials for this Owner
Home Financials are based on the most recent Mortgage that was taken out on this home.
Original Mortgage
$132,075
Interest Rate
6.21%
Mortgage Type
FHA
Create a Home Valuation Report for This Property
The Home Valuation Report is an in-depth analysis detailing your home's value as well as a comparison with similar homes in the area
Home Values in the Area
Average Home Value in this Area
Purchase History
| Date | Buyer | Sale Price | Title Company |
|---|---|---|---|
| Johnson Brittany L | -- | Hickman Land Title Logan | |
| Johnson Manuel S | -- | Cache Title Logan | |
| Mackinnon Peter D | -- | American Secure Title |
Source: Public Records
Mortgage History
| Date | Status | Borrower | Loan Amount |
|---|---|---|---|
| Open | Johnson Manuel S | $220,924 | |
| Previous Owner | Mackinnon Peter D | $132,075 |
Source: Public Records
Tax History Compared to Growth
Tax History
| Year | Tax Paid | Tax Assessment Tax Assessment Total Assessment is a certain percentage of the fair market value that is determined by local assessors to be the total taxable value of land and additions on the property. | Land | Improvement |
|---|---|---|---|---|
| 2025 | $2,209 | $285,755 | $0 | $0 |
| 2024 | $2,269 | $284,285 | $0 | $0 |
| 2023 | $2,375 | $283,530 | $0 | $0 |
| 2022 | $2,496 | $278,255 | $0 | $0 |
| 2021 | $1,955 | $336,801 | $44,000 | $292,801 |
| 2020 | $1,737 | $269,232 | $44,000 | $225,232 |
| 2019 | $1,815 | $269,232 | $44,000 | $225,232 |
| 2018 | $1,810 | $245,100 | $44,000 | $201,100 |
| 2017 | $1,802 | $129,030 | $0 | $0 |
| 2016 | $1,868 | $123,530 | $0 | $0 |
| 2015 | $1,791 | $123,530 | $0 | $0 |
| 2014 | $1,619 | $123,530 | $0 | $0 |
| 2013 | -- | $71,170 | $0 | $0 |
Source: Public Records
Map
Nearby Homes