


45 S Crescent Circuit Boston, MA 02135
Brighton NeighborhoodHighlights
- Golf Course Community
- Property is near public transit
- Park
- 99,999 Sq Ft lot
- No HOA
- Shops
About This Home
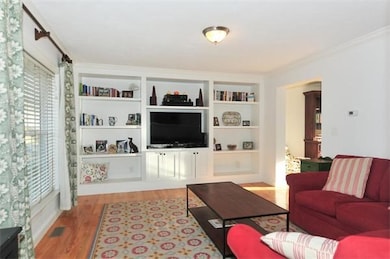
Beautiful single-family home for rent in Brighton, located near the end of a quiet street. This well-maintained home features gleaming hardwood floors, two-zone central heat and A/C, and a spacious kitchen with cherry cabinets, granite countertops, stainless steel appliances, and a center island. The finished basement offers additional living space with a wood-burning stove and French doors leading to a private deck. Steps away from a park and golf course, with easy access to major highways, the Pike, and River Roads. Two off-street parking spaces included. Tenants pay all utilities, pet is considered case by case. Unfurnished unit, furniture in the pictures does not stay.
Home Details
Home Type
- Single Family
Year Built
- Built in 2008
Lot Details
- 2.3 Acre Lot
Parking
- 2 Car Parking Spaces
Home Design
- Entry on the 1st floor
Kitchen
- Oven
- Range
- Microwave
- Freezer
- Dishwasher
- Disposal
Bedrooms and Bathrooms
- 3 Bedrooms
Laundry
- Laundry in unit
- Dryer
- Washer
Location
- Property is near public transit
- Property is near schools
Utilities
- No Cooling
- Forced Air Heating System
- Heating System Uses Natural Gas
Additional Features
- Basement
Listing and Financial Details
- Security Deposit $4,200
- Rent includes occupancy only, parking
- Assessor Parcel Number 1220629
Community Details
Recreation
- Golf Course Community
- Park
Pet Policy
- Call for details about the types of pets allowed
Additional Features
- No Home Owners Association
- Shops
Map
Property History
| Date | Event | Price | List to Sale | Price per Sq Ft |
|---|---|---|---|---|
| 11/20/2025 11/20/25 | Under Contract | -- | -- | -- |
| 10/22/2025 10/22/25 | Price Changed | $4,000 | -4.8% | $2 / Sq Ft |
| 10/06/2025 10/06/25 | For Rent | $4,200 | -- | -- |
Source: MLS Property Information Network (MLS PIN)
MLS Number: 73441992
APN: BRIG-000000-000022-004717
Disclaimer: Certain information contained herein is derived from information provided by parties other than Homes.com. All information provided is deemed reliable, but is not guaranteed to be accurate and should be independently verified.
![]() The property listing data and information, or the Images, set forth herein were provided to MLS Property Information Network, Inc. from third party sources, including sellers, lessors and public records, and were compiled by MLS Property Information Network, Inc. The property listing data and information, and the Images, are for the personal, non-commercial use of consumers having a good faith interest in purchasing or leasing listed properties of the type displayed to them and may not be used for any purpose other than to identify prospective properties which such consumers may have a good faith interest in purchasing or leasing. MLS Property Information Network, Inc. and its subscribers disclaim any and all representations and warranties as to the accuracy of the property listing data and information, or as to the accuracy of any of the Images, set forth herein.
The property listing data and information, or the Images, set forth herein were provided to MLS Property Information Network, Inc. from third party sources, including sellers, lessors and public records, and were compiled by MLS Property Information Network, Inc. The property listing data and information, and the Images, are for the personal, non-commercial use of consumers having a good faith interest in purchasing or leasing listed properties of the type displayed to them and may not be used for any purpose other than to identify prospective properties which such consumers may have a good faith interest in purchasing or leasing. MLS Property Information Network, Inc. and its subscribers disclaim any and all representations and warranties as to the accuracy of the property listing data and information, or as to the accuracy of any of the Images, set forth herein.
- 34 Larch St Unit 34
- 32 Larch St Unit 34
- 32-34 Larch St
- 18 Breck Ave Unit 18
- 142 Kenrick St Unit 36
- 12 Mina Way
- 10 Mina Way
- 427-435 Faneuil St Unit R4
- 21 Glenley Terrace
- 116 Lake Shore Rd Unit 4
- 108 Lake Shore Rd Unit 4
- 22 Bigelow St
- 8 Tremont Place
- 39 Champney St
- 99 Tremont St Unit 105
- 99 Tremont St Unit 413
- 21 Upcrest Rd
- 21 Glenmont Rd
- 461 Washington St Unit 301
- 121 Tremont St Unit B1
