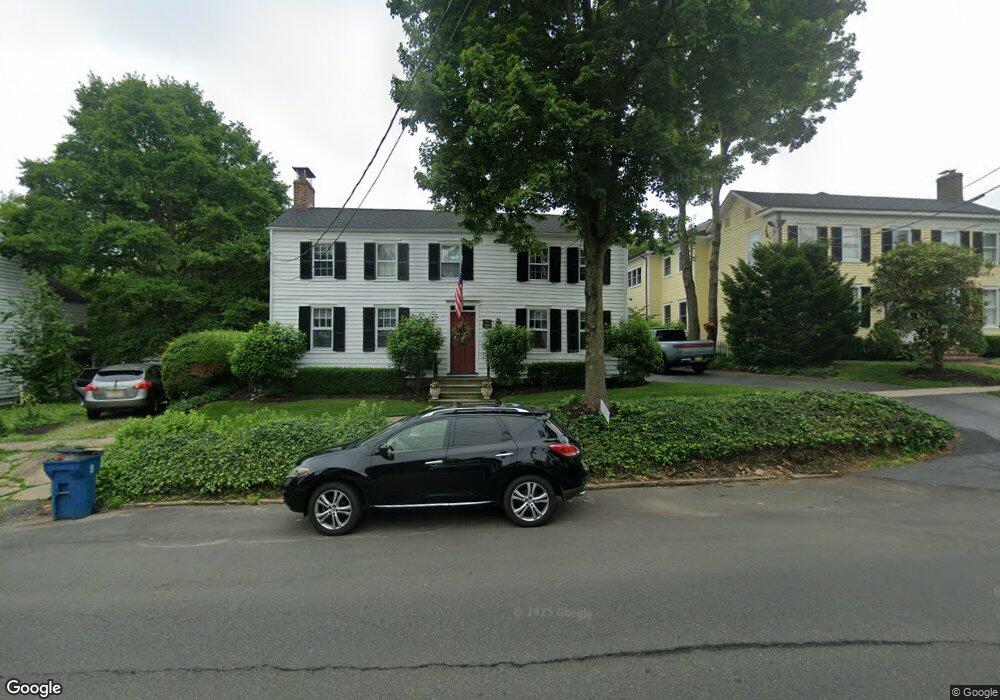
45 S Main St Cranbury, NJ 08512
Estimated Value: $844,234 - $1,081,000
4
Beds
3
Baths
2,504
Sq Ft
$385/Sq Ft
Est. Value
About This Home
This home is located at 45 S Main St, Cranbury, NJ 08512 and is currently estimated at $963,809, approximately $384 per square foot. 45 S Main St is a home located in Middlesex County with nearby schools including The Cranbury School, SciCore Academy, and E Windsor Knowledge Beginnings.
Ownership History
Date
Name
Owned For
Owner Type
Purchase Details
Closed on
May 20, 2003
Current Estimated Value
Purchase Details
Closed on
Nov 21, 1995
Sold by
Whalen James
Bought by
Jost Andrew and Jost Ruth
Home Financials for this Owner
Home Financials are based on the most recent Mortgage that was taken out on this home.
Original Mortgage
$182,000
Interest Rate
7.37%
Create a Home Valuation Report for This Property
The Home Valuation Report is an in-depth analysis detailing your home's value as well as a comparison with similar homes in the area
Home Values in the Area
Average Home Value in this Area
Purchase History
| Date | Buyer | Sale Price | Title Company |
|---|---|---|---|
| -- | -- | -- | |
| Jost Andrew | $192,000 | -- |
Source: Public Records
Mortgage History
| Date | Status | Borrower | Loan Amount |
|---|---|---|---|
| Previous Owner | Jost Andrew | $182,000 |
Source: Public Records
Tax History Compared to Growth
Tax History
| Year | Tax Paid | Tax Assessment Tax Assessment Total Assessment is a certain percentage of the fair market value that is determined by local assessors to be the total taxable value of land and additions on the property. | Land | Improvement |
|---|---|---|---|---|
| 2025 | $10,754 | $600,000 | $198,400 | $401,600 |
| 2024 | $10,598 | $600,000 | $198,400 | $401,600 |
| 2023 | $10,598 | $600,000 | $198,400 | $401,600 |
| 2022 | $10,442 | $600,000 | $198,400 | $401,600 |
| 2021 | $7,717 | $590,100 | $198,400 | $391,700 |
| 2020 | $10,254 | $590,100 | $198,400 | $391,700 |
| 2019 | $10,366 | $590,100 | $198,400 | $391,700 |
| 2018 | $11,369 | $590,100 | $198,400 | $391,700 |
| 2017 | $11,062 | $590,100 | $198,400 | $391,700 |
| 2016 | $11,407 | $590,100 | $198,400 | $391,700 |
| 2015 | $10,950 | $590,100 | $198,400 | $391,700 |
| 2014 | $10,991 | $590,100 | $198,400 | $391,700 |
Source: Public Records
Map
Nearby Homes
- 8 Arthur Ln
- 5 Arthur Ln
- 2 Arthur Ln
- 86 Labaw Dr
- 5 Trowbridge Ln
- 75 N Main St
- 0-0 Route 130
- 110 S Main St
- 6 Ryan Rd
- 2657 Route 130
- 14 Hightstown Cranbury Station Rd
- 24 Haymarket Ct
- 41 Haymarket Ct
- 95 Halsey Reed Rd
- 15 Griffin Ln
- 17 Griffin Ln
- 11 Braxton Ct
- 47 Garden View Terrace Unit 4
- 47 Garden View Terrace
- 50 -18 Garden View Terrace