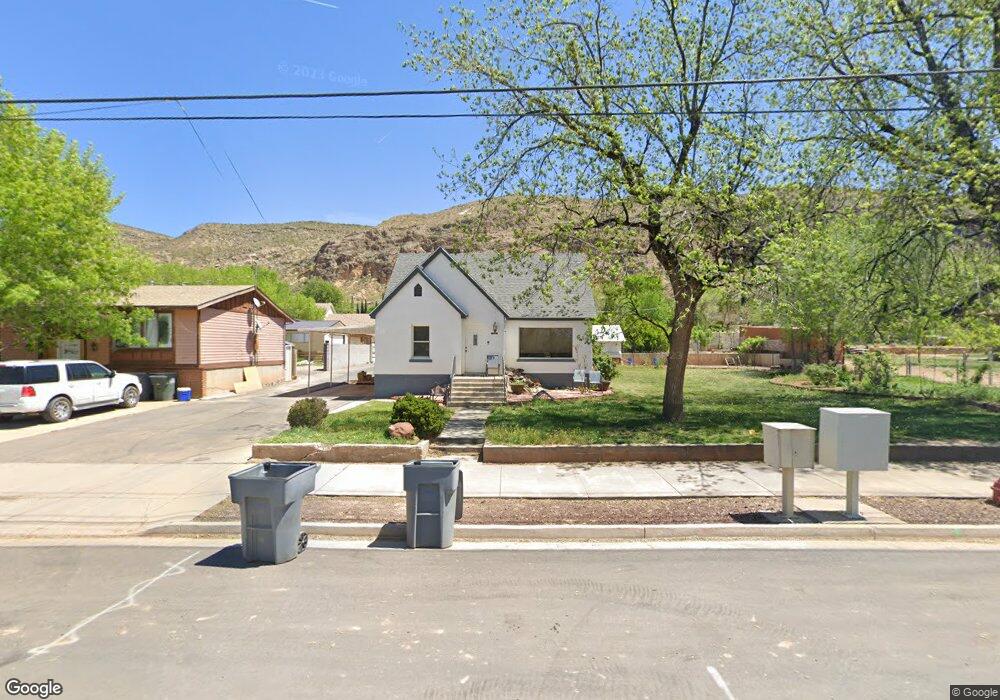
45 S Main St La Verkin, UT 84745
Estimated Value: $405,467 - $609,000
5
Beds
2
Baths
2,438
Sq Ft
$207/Sq Ft
Est. Value
About This Home
This home is located at 45 S Main St, La Verkin, UT 84745 and is currently estimated at $505,617, approximately $207 per square foot. 45 S Main St is a home located in Washington County with nearby schools including La Verkin Elementary School, Hurricane Middle School, and Hurricane High School.
Ownership History
Date
Name
Owned For
Owner Type
Purchase Details
Closed on
Jun 29, 2016
Sold by
Gubler Norene and Pierce Eldon
Bought by
Pierce Edlon Jones and Pierce Claudia
Current Estimated Value
Home Financials for this Owner
Home Financials are based on the most recent Mortgage that was taken out on this home.
Original Mortgage
$171,000
Outstanding Balance
$136,510
Interest Rate
3.58%
Mortgage Type
New Conventional
Estimated Equity
$369,107
Purchase Details
Closed on
Jan 7, 2009
Sold by
Eves Raymond J and Eves Jill D
Bought by
Gubler Norene and Pierce Eldon
Home Financials for this Owner
Home Financials are based on the most recent Mortgage that was taken out on this home.
Original Mortgage
$187,525
Interest Rate
5.97%
Mortgage Type
FHA
Purchase Details
Closed on
May 14, 2007
Sold by
Eves Jack R
Bought by
Eves Raymond J and Eves Jill P
Create a Home Valuation Report for This Property
The Home Valuation Report is an in-depth analysis detailing your home's value as well as a comparison with similar homes in the area
Home Values in the Area
Average Home Value in this Area
Purchase History
| Date | Buyer | Sale Price | Title Company |
|---|---|---|---|
| Pierce Edlon Jones | -- | Southern Utah Title | |
| Gubler Norene | -- | Southern Utah Title | |
| Eves Raymond J | -- | None Available |
Source: Public Records
Mortgage History
| Date | Status | Borrower | Loan Amount |
|---|---|---|---|
| Open | Pierce Edlon Jones | $171,000 | |
| Closed | Gubler Norene | $187,525 |
Source: Public Records
Tax History
| Year | Tax Paid | Tax Assessment Tax Assessment Total Assessment is a certain percentage of the fair market value that is determined by local assessors to be the total taxable value of land and additions on the property. | Land | Improvement |
|---|---|---|---|---|
| 2025 | $3,380 | $245,355 | $79,200 | $166,155 |
| 2023 | -- | $392,900 | $144,000 | $248,900 |
| 2022 | $3,702 | $374,100 | $96,000 | $278,100 |
| 2021 | $2,565 | $259,200 | $72,000 | $187,200 |
| 2020 | $2,519 | $238,000 | $72,000 | $166,000 |
| 2019 | $2,683 | $243,000 | $50,000 | $193,000 |
| 2018 | $2,448 | $204,100 | $0 | $0 |
| 2017 | $2,434 | $197,400 | $0 | $0 |
| 2016 | $1,289 | $100,320 | $0 | $0 |
| 2015 | $1,217 | $91,080 | $0 | $0 |
| 2014 | $1,109 | $81,840 | $0 | $0 |
Source: Public Records
Map
Nearby Homes
- 65 S Main St
- 80 W Center St Unit 13
- 728 N 15 W
- 140 S 100 W
- 57 W 180 S
- 54 E 200 S
- 0 La Verkin Lot Unit 24-252790
- 0 Lot #1 Valle Vista Unit 25-262463
- 0 Lot #4 Valle Vista Unit 25-262467
- 0 Vista Unit 25-262466
- 0 Lot #2 Valle Vista Unit 25-262464
- 161 E 130 N
- 25 E 200 N
- 200 N State St
- 72 S 250 W
- 235 N 200 E
- 235 N 200 E Unit 55
- 233 N State St
- 135 N 350 W
- 315 W 200 N
Your Personal Tour Guide
Ask me questions while you tour the home.