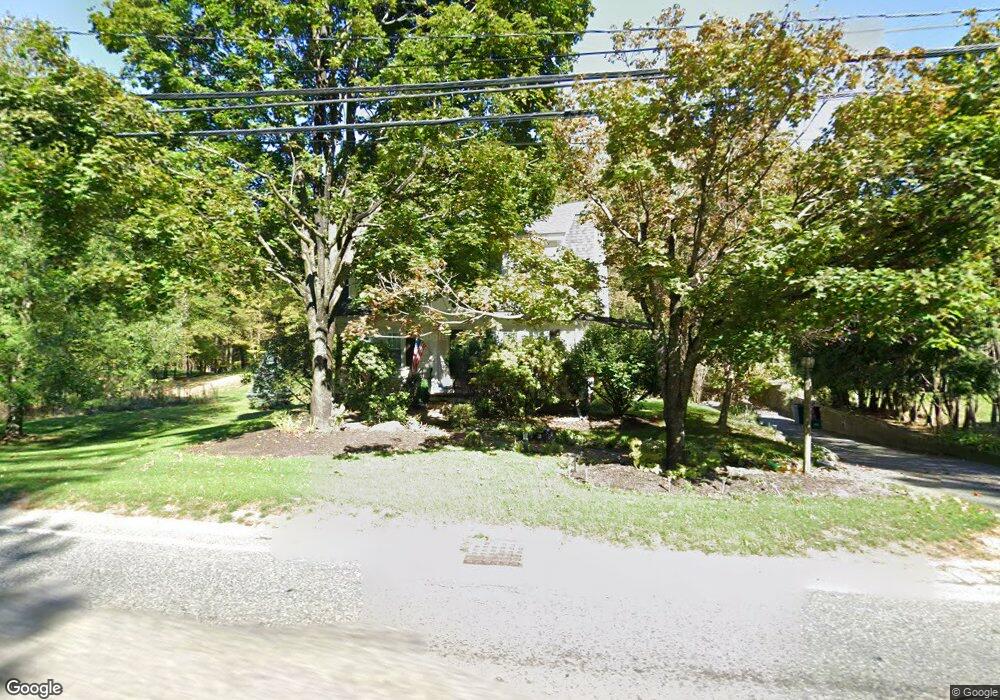
45 S Main St Sherborn, MA 01770
Estimated Value: $924,000 - $1,022,000
5
Beds
2
Baths
2,178
Sq Ft
$442/Sq Ft
Est. Value
About This Home
This home is located at 45 S Main St, Sherborn, MA 01770 and is currently estimated at $961,929, approximately $441 per square foot. 45 S Main St is a home located in Middlesex County with nearby schools including Pine Hill Elementary School, Dover-Sherborn Regional Middle School, and Dover-Sherborn Regional High School.
Ownership History
Date
Name
Owned For
Owner Type
Purchase Details
Closed on
Nov 30, 2011
Sold by
Miriam B Dayhoff Rt and Oneil Karen D
Bought by
Ocampo Palmira
Current Estimated Value
Home Financials for this Owner
Home Financials are based on the most recent Mortgage that was taken out on this home.
Original Mortgage
$328,500
Outstanding Balance
$225,685
Interest Rate
4.1%
Mortgage Type
Purchase Money Mortgage
Estimated Equity
$736,244
Create a Home Valuation Report for This Property
The Home Valuation Report is an in-depth analysis detailing your home's value as well as a comparison with similar homes in the area
Home Values in the Area
Average Home Value in this Area
Purchase History
We collect this data history from publicly available records. To have your information removed, we recommend requesting removal directly through your county’s website.
| Date | Buyer | Sale Price | Title Company |
|---|---|---|---|
| Ocampo Palmira | $365,000 | -- |
Source: Public Records
Mortgage History
We collect this data history from publicly available records. To have your information removed, we recommend requesting removal directly through your county’s website.
| Date | Status | Borrower | Loan Amount |
|---|---|---|---|
| Open | Ocampo Palmira | $328,500 |
Source: Public Records
Tax History
| Year | Tax Paid | Tax Assessment Tax Assessment Total Assessment is a certain percentage of the fair market value that is determined by local assessors to be the total taxable value of land and additions on the property. | Land | Improvement |
|---|---|---|---|---|
| 2025 | $13,077 | $788,700 | $345,300 | $443,400 |
| 2024 | $10,968 | $647,100 | $266,300 | $380,800 |
| 2023 | $9,880 | $548,600 | $266,300 | $282,300 |
| 2022 | $9,309 | $489,200 | $266,300 | $222,900 |
| 2021 | $4,799 | $428,100 | $266,300 | $161,800 |
| 2020 | $4,490 | $428,100 | $266,300 | $161,800 |
| 2019 | $8,356 | $425,900 | $266,300 | $159,600 |
| 2018 | $8,116 | $420,500 | $266,300 | $154,200 |
| 2017 | $7,867 | $384,500 | $252,900 | $131,600 |
| 2016 | $7,841 | $381,200 | $252,900 | $128,300 |
| 2015 | $7,630 | $375,500 | $245,800 | $129,700 |
| 2014 | $7,186 | $353,300 | $230,800 | $122,500 |
Source: Public Records
Map
Nearby Homes
- 3 Maple St
- 14 Sewall Brook Ln
- 8 Washington St
- 14 Abbey Rd Unit 14
- 63 Farm Road Lot 5
- 75 Washington St
- 44 Maple St
- 102 Washington St
- 137 Lake St
- 90 Maple St
- 147 Washington Street Lot 2
- 59 Prospect St
- 177 Maple St
- 17 Wyndemere Ln
- 76 Hollis St
- 11 Morgan Dr Unit 407
- 7 Nason Hill Ln
- 9 Morgan Dr Unit 309
- 50 Yorkshire Rd
- 3 Knollcrest Farm Ln
Your Personal Tour Guide
Ask me questions while you tour the home.