Estimated Value: $592,000
--
Bed
--
Bath
--
Sq Ft
0.77
Acres
About This Home
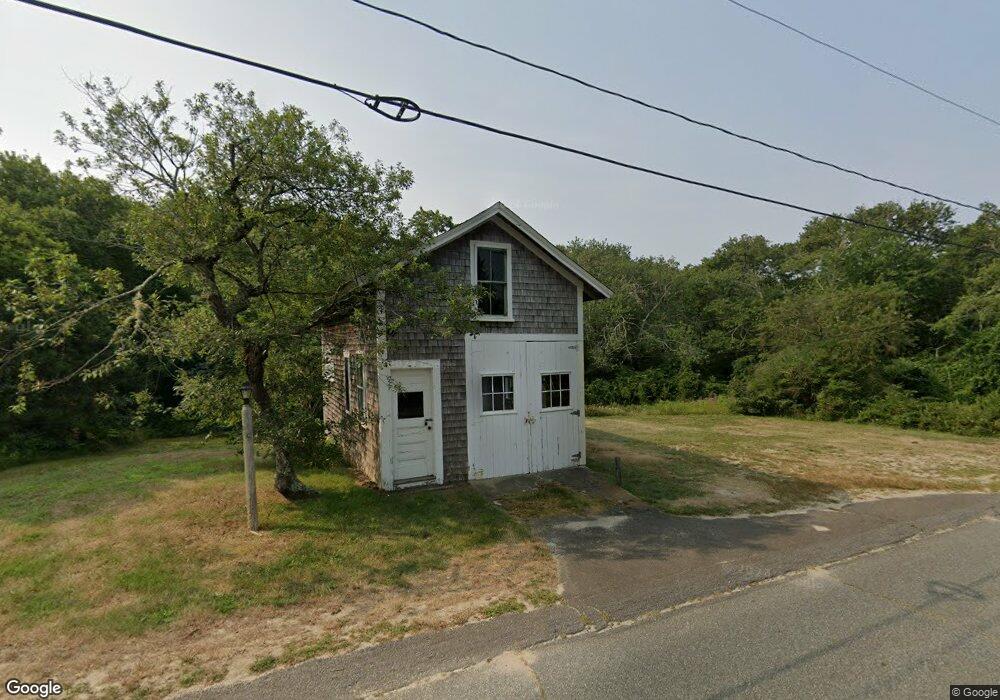
This home is located at 45 S Pamet Rd, Truro, MA 2666 and is currently estimated at $592,000. 45 S Pamet Rd is a home located in Barnstable County.
Ownership History
Date
Name
Owned For
Owner Type
Purchase Details
Closed on
Dec 18, 2023
Sold by
Manuel Furer Qtip Non T and Manuel Wyman
Bought by
Manuel Furer Article 10 T and Manuel Furer
Current Estimated Value
Purchase Details
Closed on
Dec 13, 2023
Sold by
Vivian Furer Ret and Furer
Bought by
Vivian Furer Article 10 T and Vivian Furer
Purchase Details
Closed on
Oct 29, 2020
Sold by
Manuel Furer Ret and Furer
Bought by
Manuel Furer Qtip T and Manuel Wyman
Purchase Details
Closed on
Nov 25, 2016
Sold by
Furer Vivian A
Bought by
Manuel Furer Ret and Furer
Purchase Details
Closed on
Feb 21, 2013
Sold by
Furer Manuel and Furer Vivian
Bought by
Furer Vivian
Purchase Details
Closed on
Oct 24, 2007
Sold by
Vivian Furer T and Vivian Furer
Bought by
Furer Andrew J
Create a Home Valuation Report for This Property
The Home Valuation Report is an in-depth analysis detailing your home's value as well as a comparison with similar homes in the area
Home Values in the Area
Average Home Value in this Area
Purchase History
| Date | Buyer | Sale Price | Title Company |
|---|---|---|---|
| Manuel Furer Article 10 T | -- | None Available | |
| Vivian Furer Article 10 T | -- | None Available | |
| Manuel Furer Qtip T | -- | None Available | |
| Manuel Furer Ret | -- | -- | |
| Furer Vivian | -- | -- | |
| Furer Andrew J | -- | -- |
Source: Public Records
Tax History Compared to Growth
Tax History
| Year | Tax Paid | Tax Assessment Tax Assessment Total Assessment is a certain percentage of the fair market value that is determined by local assessors to be the total taxable value of land and additions on the property. | Land | Improvement |
|---|---|---|---|---|
| 2025 | $530 | $85,800 | $23,000 | $62,800 |
| 2024 | $508 | $84,800 | $22,800 | $62,000 |
| 2023 | $479 | $73,200 | $19,800 | $53,400 |
| 2022 | $441 | $57,000 | $17,100 | $39,900 |
| 2021 | $402 | $54,500 | $17,100 | $37,400 |
| 2020 | $400 | $54,600 | $16,900 | $37,700 |
| 2019 | $404 | $54,200 | $18,100 | $36,100 |
| 2018 | $336 | $45,600 | $12,500 | $33,100 |
| 2017 | $309 | $44,200 | $12,500 | $31,700 |
| 2016 | $297 | $43,900 | $12,300 | $31,600 |
| 2015 | $285 | $43,000 | $12,200 | $30,800 |
Source: Public Records
Map
Nearby Homes