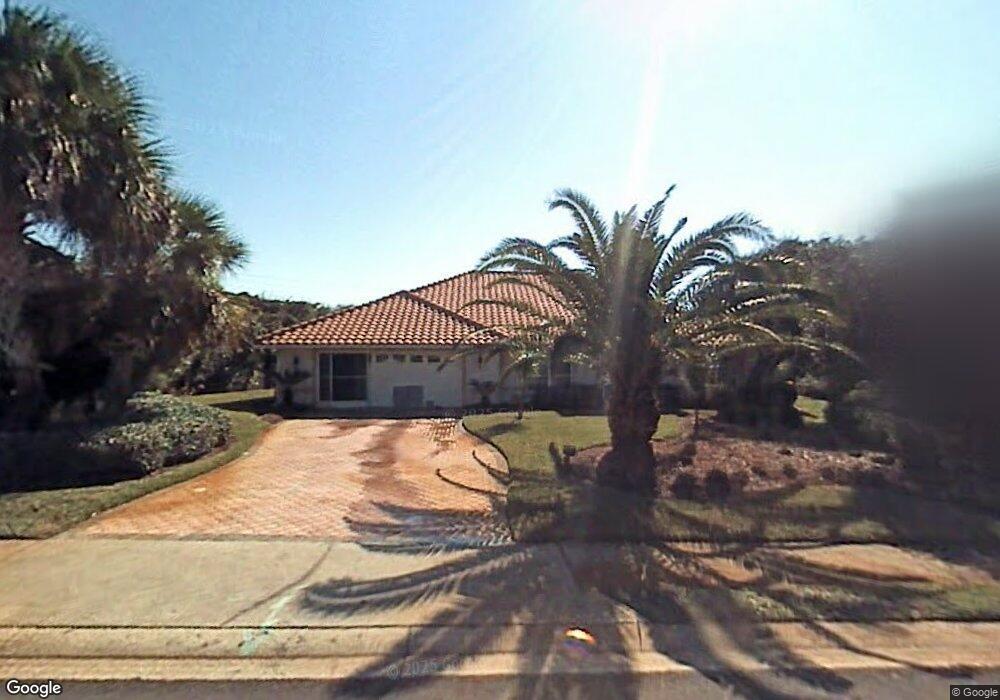
45 S Turn Cir Ponce Inlet, FL 32127
Estimated Value: $845,000 - $1,055,000
3
Beds
2
Baths
2,388
Sq Ft
$387/Sq Ft
Est. Value
About This Home
This home is located at 45 S Turn Cir, Ponce Inlet, FL 32127 and is currently estimated at $925,033, approximately $387 per square foot. 45 S Turn Cir is a home located in Volusia County with nearby schools including R.J. Longstreet Elementary School, Kullerstrand Elementary School, and Silver Sands Middle School.
Ownership History
Date
Name
Owned For
Owner Type
Purchase Details
Closed on
Feb 12, 2003
Sold by
Nugent Mary and Nugent Robert
Bought by
Moore Gerald E and Moore Linda L
Current Estimated Value
Purchase Details
Closed on
Nov 20, 2001
Sold by
Carpenter William and Carpenter Judith
Bought by
Nugent Mary
Home Financials for this Owner
Home Financials are based on the most recent Mortgage that was taken out on this home.
Original Mortgage
$279,300
Interest Rate
6.54%
Purchase Details
Closed on
Jun 9, 1993
Sold by
Michaluk Gerald R and Michaluk Nancy F
Bought by
Carpenter William Ward and Carpenter Judith Ann
Purchase Details
Closed on
Jul 15, 1992
Bought by
Costin Douglas L and Costin Kim L
Create a Home Valuation Report for This Property
The Home Valuation Report is an in-depth analysis detailing your home's value as well as a comparison with similar homes in the area
Home Values in the Area
Average Home Value in this Area
Purchase History
| Date | Buyer | Sale Price | Title Company |
|---|---|---|---|
| Moore Gerald E | -- | -- | |
| Costin Douglas L | $295,000 | -- | |
| Moore Gerald E | $125,000 | -- | |
| Nugent Mary | $399,000 | -- | |
| Carpenter William Ward | $55,000 | -- | |
| Costin Douglas L | $45,000 | -- |
Source: Public Records
Mortgage History
| Date | Status | Borrower | Loan Amount |
|---|---|---|---|
| Previous Owner | Nugent Mary | $279,300 | |
| Previous Owner | Carpenter William Ward | $142,000 | |
| Previous Owner | Carpenter William Ward | $100,000 |
Source: Public Records
Tax History Compared to Growth
Tax History
| Year | Tax Paid | Tax Assessment Tax Assessment Total Assessment is a certain percentage of the fair market value that is determined by local assessors to be the total taxable value of land and additions on the property. | Land | Improvement |
|---|---|---|---|---|
| 2025 | $14,507 | $839,402 | $258,273 | $581,129 |
| 2024 | $12,786 | $875,173 | $292,417 | $582,756 |
| 2023 | $12,786 | $795,633 | $221,502 | $574,131 |
| 2022 | $10,955 | $680,812 | $175,100 | $505,712 |
| 2021 | $10,344 | $531,383 | $107,249 | $424,134 |
| 2020 | $9,852 | $527,613 | $107,249 | $420,364 |
| 2019 | $8,770 | $451,340 | $100,874 | $350,466 |
| 2018 | $8,343 | $422,390 | $100,874 | $321,516 |
| 2017 | $9,791 | $485,067 | $105,324 | $379,743 |
| 2016 | $9,584 | $459,464 | $0 | $0 |
| 2015 | $9,195 | $439,528 | $0 | $0 |
| 2014 | $8,391 | $374,710 | $0 | $0 |
Source: Public Records
Map
Nearby Homes
- 38 S Turn Cir
- 55 Inlet Point Blvd
- 105 Beach St
- 116 Rains Dr
- 120 Beach St
- 110 Ocean Way Dr
- 4895 Sailfish Dr
- 17 Mar Azul N
- 0 River Front Land Unit O6083253
- 4799 S Atlantic Ave Unit 1030
- 29 Mar Azul N
- 36 Mar Azul N
- 30 Inlet Harbor Rd Unit 606
- 30 Inlet Harbor Rd Unit 503
- 30 Inlet Harbor Rd Unit 5030
- 62 Buschman Dr
- 4786 S Atlantic Ave
- 4786 S Atlantic Ave Unit 4B
- 4786 S Atlantic Ave Unit B1
- 116 Inlet Harbor Rd