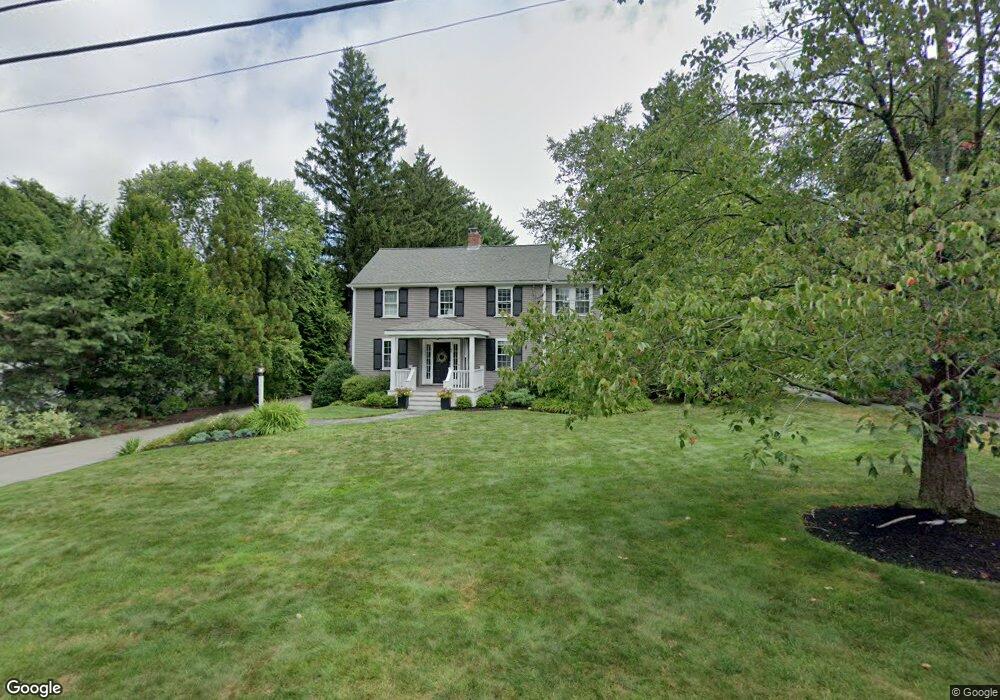
45 Shade St Lexington, MA 02421
Idylwilde NeighborhoodEstimated Value: $1,862,000 - $2,378,000
4
Beds
4
Baths
3,356
Sq Ft
$616/Sq Ft
Est. Value
About This Home
This home is located at 45 Shade St, Lexington, MA 02421 and is currently estimated at $2,067,858, approximately $616 per square foot. 45 Shade St is a home located in Middlesex County with nearby schools including Bridge Elementary School, Jonas Clarke Middle School, and Lexington High School.
Ownership History
Date
Name
Owned For
Owner Type
Purchase Details
Closed on
Oct 15, 2024
Sold by
Gelnaw William P and Gelnaw Michelle D
Bought by
45 Shade Street Rt and Cheever
Current Estimated Value
Purchase Details
Closed on
Aug 25, 1992
Sold by
Mack Warren W and Mack Donna E
Bought by
Gelnaw William P and Gelnaw Michelle D
Home Financials for this Owner
Home Financials are based on the most recent Mortgage that was taken out on this home.
Original Mortgage
$336,600
Interest Rate
8.12%
Mortgage Type
Purchase Money Mortgage
Create a Home Valuation Report for This Property
The Home Valuation Report is an in-depth analysis detailing your home's value as well as a comparison with similar homes in the area
Home Values in the Area
Average Home Value in this Area
Purchase History
| Date | Buyer | Sale Price | Title Company |
|---|---|---|---|
| 45 Shade Street Rt | -- | None Available | |
| 45 Shade Street Rt | -- | None Available | |
| Gelnaw William P | $396,000 | -- | |
| Gelnaw William P | $396,000 | -- |
Source: Public Records
Mortgage History
| Date | Status | Borrower | Loan Amount |
|---|---|---|---|
| Previous Owner | Gelnaw William P | $336,600 | |
| Previous Owner | Gelnaw William P | $43,000 |
Source: Public Records
Tax History
| Year | Tax Paid | Tax Assessment Tax Assessment Total Assessment is a certain percentage of the fair market value that is determined by local assessors to be the total taxable value of land and additions on the property. | Land | Improvement |
|---|---|---|---|---|
| 2025 | $21,133 | $1,728,000 | $764,000 | $964,000 |
| 2024 | $20,629 | $1,684,000 | $728,000 | $956,000 |
| 2023 | $20,280 | $1,560,000 | $662,000 | $898,000 |
| 2022 | $19,016 | $1,378,000 | $602,000 | $776,000 |
| 2021 | $18,261 | $1,269,000 | $574,000 | $695,000 |
| 2020 | $17,619 | $1,254,000 | $574,000 | $680,000 |
| 2019 | $16,916 | $1,198,000 | $547,000 | $651,000 |
| 2018 | $16,588 | $1,160,000 | $521,000 | $639,000 |
| 2017 | $14,273 | $985,000 | $480,000 | $505,000 |
| 2016 | $14,439 | $989,000 | $457,000 | $532,000 |
| 2015 | $14,147 | $952,000 | $416,000 | $536,000 |
| 2014 | $14,316 | $923,000 | $370,000 | $553,000 |
Source: Public Records
Map
Nearby Homes
- 22 Fairbanks Rd
- 8 Phinney Rd
- 94 Middle St
- 72 Grassland St
- 14 Benjamin Rd
- 17 Prospect Hill Rd
- 542 Concord Ave
- 7 Field Rd
- 2 Effie Place
- 5 Leroy Rd
- 671 Marrett Rd
- 367 Waltham St Unit 5
- 8 Common Ct
- 8 Common Ct Unit 8
- 18 Common Ct Unit 18
- 19 Deering Ave
- 24 Deering Ave
- 3 Effie Place
- 167 Lexington Rd N
- 18 Baskin Rd
Your Personal Tour Guide
Ask me questions while you tour the home.