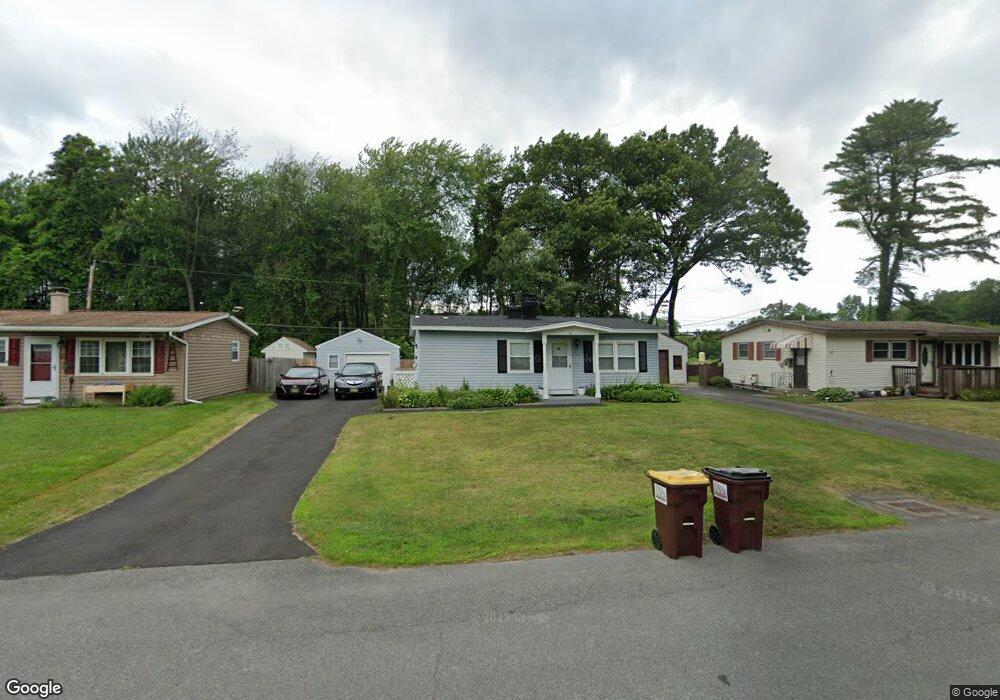
45 Sherwood Dr Latham, NY 12110
Estimated Value: $200,000 - $265,474
3
Beds
1
Bath
825
Sq Ft
$293/Sq Ft
Est. Value
About This Home
This home is located at 45 Sherwood Dr, Latham, NY 12110 and is currently estimated at $241,619, approximately $292 per square foot. 45 Sherwood Dr is a home located in Albany County with nearby schools including Southgate School, Shaker Junior High School, and Shaker High School.
Ownership History
Date
Name
Owned For
Owner Type
Purchase Details
Closed on
Apr 30, 2010
Sold by
Ogborn Richard D
Bought by
Quinones Lucas and Quinones Felicia
Current Estimated Value
Home Financials for this Owner
Home Financials are based on the most recent Mortgage that was taken out on this home.
Original Mortgage
$9,350
Outstanding Balance
$6,261
Interest Rate
5.03%
Mortgage Type
Purchase Money Mortgage
Estimated Equity
$235,358
Purchase Details
Closed on
Oct 19, 2001
Sold by
Ogborn Donald M
Bought by
Ogborn Richard D
Create a Home Valuation Report for This Property
The Home Valuation Report is an in-depth analysis detailing your home's value as well as a comparison with similar homes in the area
Home Values in the Area
Average Home Value in this Area
Purchase History
| Date | Buyer | Sale Price | Title Company |
|---|---|---|---|
| Quinones Lucas | $93,500 | None Available | |
| Ogborn Richard D | -- | -- |
Source: Public Records
Mortgage History
| Date | Status | Borrower | Loan Amount |
|---|---|---|---|
| Open | Quinones Lucas | $9,350 | |
| Open | Quinones Lucas | $84,150 |
Source: Public Records
Tax History Compared to Growth
Tax History
| Year | Tax Paid | Tax Assessment Tax Assessment Total Assessment is a certain percentage of the fair market value that is determined by local assessors to be the total taxable value of land and additions on the property. | Land | Improvement |
|---|---|---|---|---|
| 2024 | $3,245 | $72,000 | $18,000 | $54,000 |
| 2023 | $3,162 | $72,000 | $18,000 | $54,000 |
| 2022 | $3,078 | $72,000 | $18,000 | $54,000 |
| 2021 | $3,065 | $72,000 | $18,000 | $54,000 |
| 2020 | $2,510 | $72,000 | $18,000 | $54,000 |
| 2019 | $1,461 | $72,000 | $18,000 | $54,000 |
| 2018 | $2,442 | $72,000 | $18,000 | $54,000 |
| 2017 | $0 | $72,000 | $18,000 | $54,000 |
| 2016 | $2,356 | $72,000 | $18,000 | $54,000 |
| 2015 | -- | $72,000 | $18,000 | $54,000 |
| 2014 | -- | $72,000 | $18,000 | $54,000 |
Source: Public Records
Map
Nearby Homes