J
Seller's Agent in 2018
John Flavin
Flavin & Flavin Real Estate
(617) 479-1000
3 in this area
8 Total Sales

Estimated Value: $882,000 - $972,000
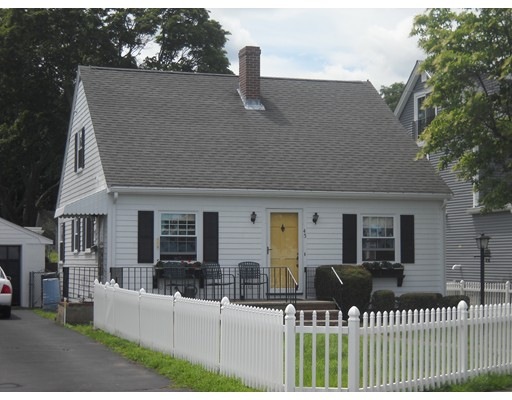
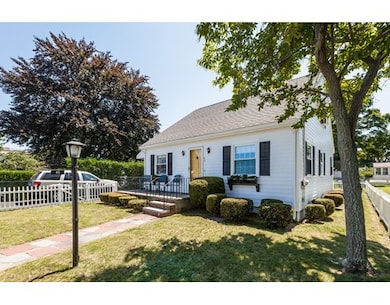
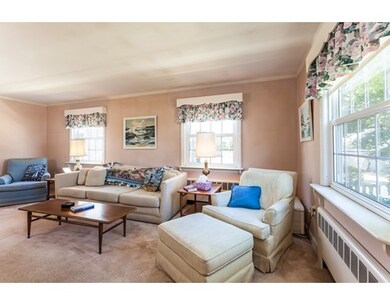
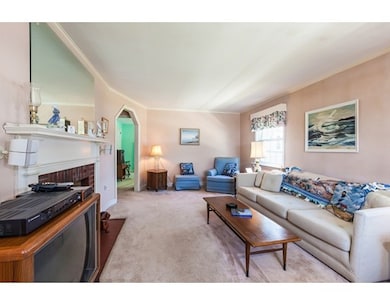
Merrymount. Water views of Quincy Bay from this classic well maintained Cape at Merrymount Beach. Newly painted, newer roof, replacement windows. Fenced front and rear yards, Gas heat with recessed radiation. Concrete block garage with automatic garage door. Generator for emergencies when the power is down. Master Bedroom and full bath on second floor with additional room for expansion. Even though across from the beach, not in a flood zone.
Home Type
Single Family
Est. Annual Taxes
$9,144
Year Built
1950
Lot Details
0
| Date | Buyer | Sale Price | Title Company |
|---|---|---|---|
| Clune-Fernandez Irt | -- | None Available | |
| Joseph T Cavanagh T T | -- | -- |
| Date | Status | Borrower | Loan Amount |
|---|---|---|---|
| Previous Owner | Clune Daniel J | $262,500 | |
| Previous Owner | Clune 3Rd Daniel J | $300,000 |
| Date | Event | Price | Change | Sq Ft Price |
|---|---|---|---|---|
| 01/12/2018 01/12/18 | Sold | $550,000 | -5.0% | $435 / Sq Ft |
| 10/13/2017 10/13/17 | Pending | -- | -- | -- |
| 09/29/2017 09/29/17 | For Sale | $579,000 | +5.3% | $458 / Sq Ft |
| 09/28/2017 09/28/17 | Off Market | $550,000 | -- | -- |
| 09/25/2017 09/25/17 | Price Changed | $579,000 | -1.7% | $458 / Sq Ft |
| 09/06/2017 09/06/17 | Price Changed | $589,000 | -1.7% | $466 / Sq Ft |
| 08/21/2017 08/21/17 | For Sale | $599,000 | 0.0% | $474 / Sq Ft |
| 08/01/2017 08/01/17 | Pending | -- | -- | -- |
| 07/28/2017 07/28/17 | For Sale | $599,000 | -- | $474 / Sq Ft |
| Year | Tax Paid | Tax Assessment Tax Assessment Total Assessment is a certain percentage of the fair market value that is determined by local assessors to be the total taxable value of land and additions on the property. | Land | Improvement |
|---|---|---|---|---|
| 2025 | $9,144 | $793,100 | $491,700 | $301,400 |
| 2024 | $8,672 | $769,500 | $477,400 | $292,100 |
| 2023 | $7,663 | $688,500 | $415,100 | $273,400 |
| 2022 | $7,468 | $623,400 | $369,700 | $253,700 |
| 2021 | $7,747 | $638,100 | $393,600 | $244,500 |
| 2020 | $7,795 | $627,100 | $378,500 | $248,600 |
| 2019 | $7,197 | $573,500 | $353,700 | $219,800 |
| 2018 | $6,975 | $522,900 | $311,400 | $211,500 |
| 2017 | $7,310 | $515,900 | $335,500 | $180,400 |
| 2016 | $7,153 | $498,100 | $329,400 | $168,700 |
| 2015 | $6,899 | $472,500 | $310,800 | $161,700 |
| 2014 | $6,642 | $447,000 | $309,900 | $137,100 |
J
Seller's Agent in 2018
John Flavin
Flavin & Flavin Real Estate
(617) 479-1000
3 in this area
8 Total Sales
Source: MLS Property Information Network (MLS PIN)
MLS Number: 72205885
APN: QUIN-001105U-000020-B000000
Disclaimer: Certain information contained herein is derived from information provided by parties other than Homes.com. All information provided is deemed reliable, but is not guaranteed to be accurate and should be independently verified.
![]() The property listing data and information, or the Images, set forth herein were provided to MLS Property Information Network, Inc. from third party sources, including sellers, lessors and public records, and were compiled by MLS Property Information Network, Inc. The property listing data and information, and the Images, are for the personal, non-commercial use of consumers having a good faith interest in purchasing or leasing listed properties of the type displayed to them and may not be used for any purpose other than to identify prospective properties which such consumers may have a good faith interest in purchasing or leasing. MLS Property Information Network, Inc. and its subscribers disclaim any and all representations and warranties as to the accuracy of the property listing data and information, or as to the accuracy of any of the Images, set forth herein.
The property listing data and information, or the Images, set forth herein were provided to MLS Property Information Network, Inc. from third party sources, including sellers, lessors and public records, and were compiled by MLS Property Information Network, Inc. The property listing data and information, and the Images, are for the personal, non-commercial use of consumers having a good faith interest in purchasing or leasing listed properties of the type displayed to them and may not be used for any purpose other than to identify prospective properties which such consumers may have a good faith interest in purchasing or leasing. MLS Property Information Network, Inc. and its subscribers disclaim any and all representations and warranties as to the accuracy of the property listing data and information, or as to the accuracy of any of the Images, set forth herein.
