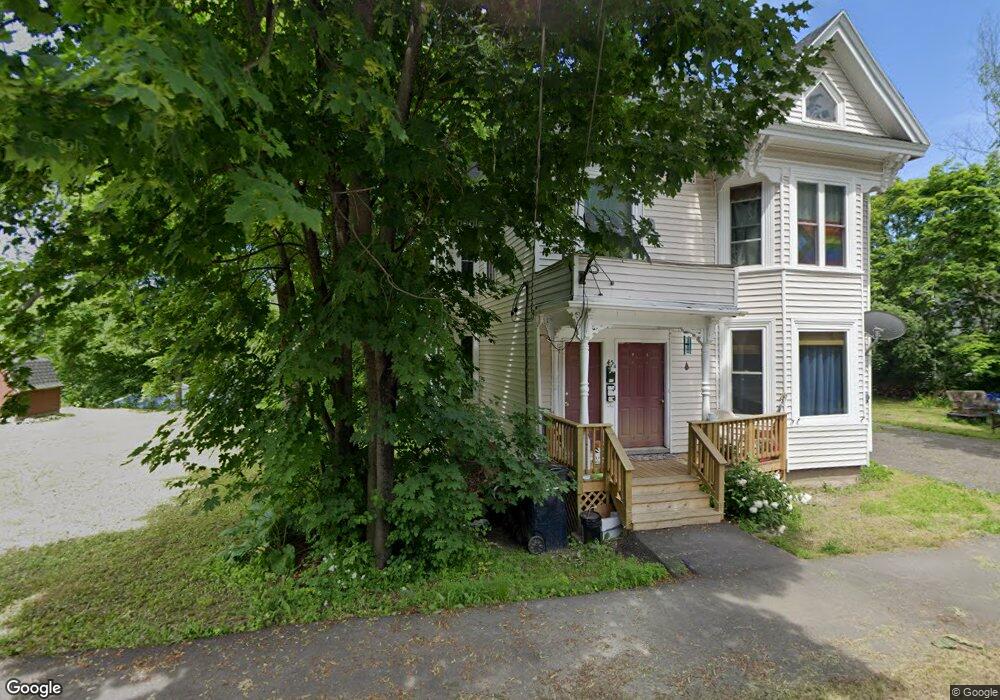
45 Sidney St Bangor, ME 04401
West Bangor NeighborhoodEstimated Value: $211,000 - $290,000
4
Beds
2
Baths
2,196
Sq Ft
$113/Sq Ft
Est. Value
About This Home
This home is located at 45 Sidney St, Bangor, ME 04401 and is currently estimated at $247,767, approximately $112 per square foot. 45 Sidney St is a home with nearby schools including Vine Street School, Fairmount School, and James F. Doughty School.
Ownership History
Date
Name
Owned For
Owner Type
Purchase Details
Closed on
Sep 11, 2019
Sold by
Kjm Property Mgmt Llc
Bought by
White Elaine
Current Estimated Value
Home Financials for this Owner
Home Financials are based on the most recent Mortgage that was taken out on this home.
Original Mortgage
$92,950
Outstanding Balance
$81,583
Interest Rate
3.7%
Mortgage Type
New Conventional
Estimated Equity
$166,184
Purchase Details
Closed on
Feb 15, 2008
Sold by
Norsworthy Lisa M
Bought by
Kjm Property Mgmt Llc
Create a Home Valuation Report for This Property
The Home Valuation Report is an in-depth analysis detailing your home's value as well as a comparison with similar homes in the area
Home Values in the Area
Average Home Value in this Area
Purchase History
| Date | Buyer | Sale Price | Title Company |
|---|---|---|---|
| White Elaine | -- | -- | |
| Kjm Property Mgmt Llc | $1,001 | -- |
Source: Public Records
Mortgage History
| Date | Status | Borrower | Loan Amount |
|---|---|---|---|
| Open | White Elaine | $92,950 |
Source: Public Records
Tax History Compared to Growth
Tax History
| Year | Tax Paid | Tax Assessment Tax Assessment Total Assessment is a certain percentage of the fair market value that is determined by local assessors to be the total taxable value of land and additions on the property. | Land | Improvement |
|---|---|---|---|---|
| 2024 | $2,992 | $161,300 | $19,400 | $141,900 |
| 2023 | $2,823 | $147,400 | $19,400 | $128,000 |
| 2022 | $2,652 | $130,000 | $19,400 | $110,600 |
| 2021 | $2,440 | $109,400 | $18,000 | $91,400 |
| 2020 | $2,294 | $98,900 | $17,100 | $81,800 |
| 2019 | $2,190 | $95,200 | $17,100 | $78,100 |
| 2018 | $1,978 | $86,200 | $16,700 | $69,500 |
| 2017 | $1,987 | $88,100 | $16,700 | $71,400 |
| 2016 | $1,987 | $88,300 | $16,700 | $71,600 |
| 2015 | $1,938 | $88,300 | $16,700 | $71,600 |
| 2014 | $1,899 | $87,100 | $16,700 | $70,400 |
| 2013 | $1,810 | $87,000 | $16,600 | $70,400 |
Source: Public Records
Map
Nearby Homes