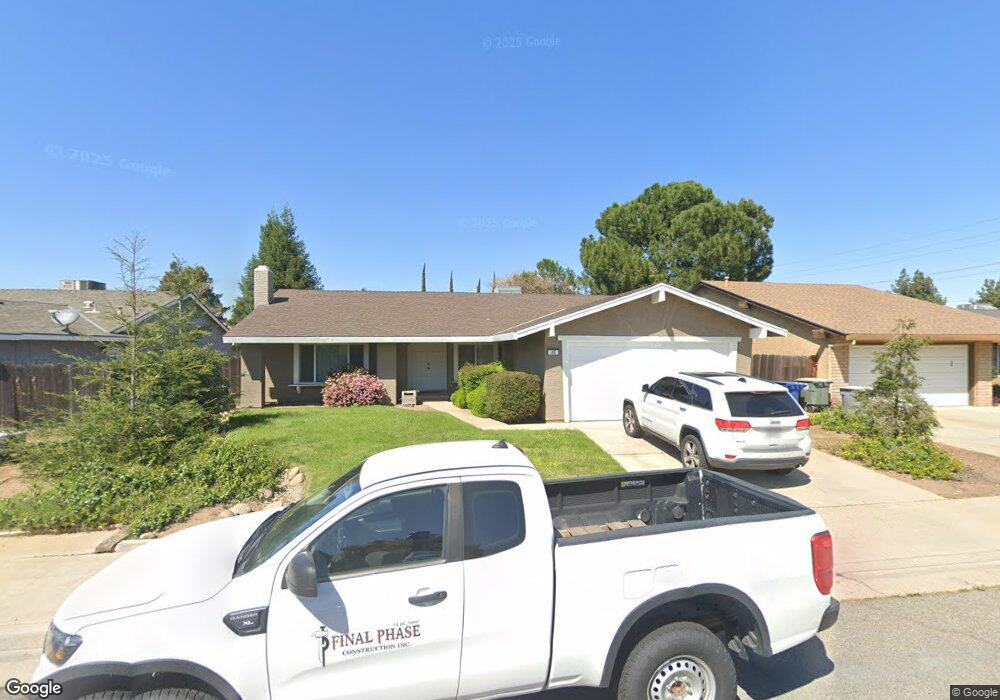
45 Snowmass Ct Merced, CA 95348
North Merced NeighborhoodEstimated Value: $352,742 - $392,000
3
Beds
2
Baths
1,557
Sq Ft
$240/Sq Ft
Est. Value
About This Home
This home is located at 45 Snowmass Ct, Merced, CA 95348 and is currently estimated at $373,436, approximately $239 per square foot. 45 Snowmass Ct is a home located in Merced County with nearby schools including Allan Peterson Elementary School, Herbert H. Cruickshank Middle School, and Merced High School.
Ownership History
Date
Name
Owned For
Owner Type
Purchase Details
Closed on
Sep 26, 2006
Sold by
Viscarra Alfonso D and Viscarra Rebecca S
Bought by
Viscarra Alfonso D and Viscarra Rebecca S
Current Estimated Value
Purchase Details
Closed on
May 21, 2001
Sold by
Va
Bought by
Viscarra Alfonso D and Viscarra Rebecca S
Home Financials for this Owner
Home Financials are based on the most recent Mortgage that was taken out on this home.
Original Mortgage
$104,000
Interest Rate
7.26%
Mortgage Type
Purchase Money Mortgage
Create a Home Valuation Report for This Property
The Home Valuation Report is an in-depth analysis detailing your home's value as well as a comparison with similar homes in the area
Home Values in the Area
Average Home Value in this Area
Purchase History
| Date | Buyer | Sale Price | Title Company |
|---|---|---|---|
| Viscarra Alfonso D | -- | None Available | |
| Viscarra Alfonso D | -- | Fidelity National Title |
Source: Public Records
Mortgage History
| Date | Status | Borrower | Loan Amount |
|---|---|---|---|
| Previous Owner | Viscarra Alfonso D | $104,000 |
Source: Public Records
Tax History
| Year | Tax Paid | Tax Assessment Tax Assessment Total Assessment is a certain percentage of the fair market value that is determined by local assessors to be the total taxable value of land and additions on the property. | Land | Improvement |
|---|---|---|---|---|
| 2025 | $1,635 | $154,746 | $42,248 | $112,498 |
| 2024 | $1,635 | $151,713 | $41,420 | $110,293 |
| 2023 | $1,612 | $148,739 | $40,608 | $108,131 |
| 2022 | $1,590 | $145,823 | $39,812 | $106,011 |
| 2021 | $1,587 | $142,965 | $39,032 | $103,933 |
| 2020 | $1,598 | $141,500 | $38,632 | $102,868 |
| 2019 | $1,574 | $138,726 | $37,875 | $100,851 |
| 2018 | $1,435 | $136,007 | $37,133 | $98,874 |
| 2017 | $1,490 | $133,341 | $36,405 | $96,936 |
| 2016 | $1,467 | $130,728 | $35,692 | $95,036 |
| 2015 | $1,443 | $128,765 | $35,156 | $93,609 |
| 2014 | $1,412 | $126,244 | $34,468 | $91,776 |
Source: Public Records
Map
Nearby Homes
- 6 Westmont Ct
- 19 Sun Valley Ct
- 310 Buena Vista Ct
- 3514 Oakhurst Ave
- 3552 Wathen Ct
- 3519 Cordova Ave
- 512 Spalding Ct
- 589 Leslie Ct
- 692 Gateway Cir
- 945 Gazelle Ct
- 3350 M St Unit 74
- 639 W Donna Dr
- 3583 Vernal Ave
- 642 W Yosemite Ave
- 591 Bobolink Ct Unit 2
- 3216 El Capitan Ave
- 1048 Vernal Ave
- 3191 El Capitan Ave
- 544 Seminole Dr
- 724 Robin Dr
Your Personal Tour Guide
Ask me questions while you tour the home.