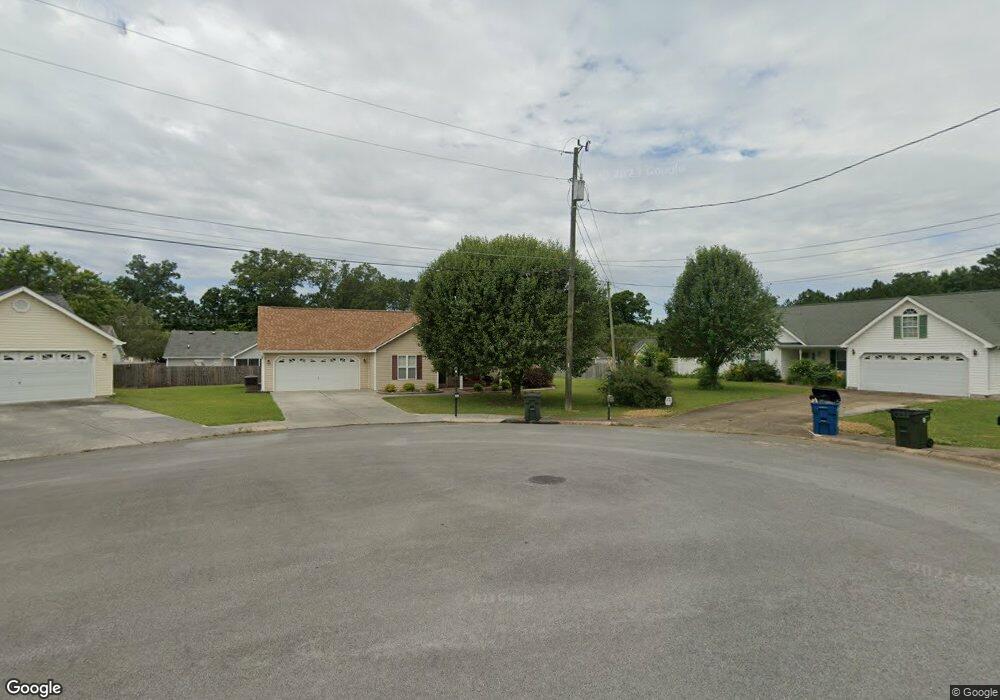
45 Stone Edge Ct Fort Oglethorpe, GA 30742
Estimated Value: $259,915 - $279,000
3
Beds
2
Baths
1,202
Sq Ft
$223/Sq Ft
Est. Value
About This Home
This home is located at 45 Stone Edge Ct, Fort Oglethorpe, GA 30742 and is currently estimated at $268,229, approximately $223 per square foot. 45 Stone Edge Ct is a home located in Catoosa County with nearby schools including Cloud Springs Elementary School, Lakeview Middle School, and Lakeview-Fort Oglethorpe High School.
Ownership History
Date
Name
Owned For
Owner Type
Purchase Details
Closed on
Sep 16, 2013
Sold by
Middlebrooks Joshua L
Bought by
Davis Regis P
Current Estimated Value
Home Financials for this Owner
Home Financials are based on the most recent Mortgage that was taken out on this home.
Original Mortgage
$30,000
Outstanding Balance
$7,671
Interest Rate
4.39%
Mortgage Type
New Conventional
Estimated Equity
$260,558
Purchase Details
Closed on
May 27, 2010
Sold by
Middlebrooks Joshua L
Bought by
Middlebrooks Joshua L
Purchase Details
Closed on
May 30, 2006
Sold by
Fritschmann Robert D
Bought by
Middlebrooks Joshua L
Purchase Details
Closed on
May 26, 2006
Sold by
Not Provided
Bought by
Middlebrooks Joshua L and Middlebrooks Dee
Create a Home Valuation Report for This Property
The Home Valuation Report is an in-depth analysis detailing your home's value as well as a comparison with similar homes in the area
Home Values in the Area
Average Home Value in this Area
Purchase History
| Date | Buyer | Sale Price | Title Company |
|---|---|---|---|
| Davis Regis P | $105,000 | -- | |
| Middlebrooks Joshua L | -- | -- | |
| Middlebrooks Joshua L | $116,000 | -- | |
| Middlebrooks Joshua L | $116,000 | -- |
Source: Public Records
Mortgage History
| Date | Status | Borrower | Loan Amount |
|---|---|---|---|
| Open | Davis Regis P | $30,000 |
Source: Public Records
Tax History Compared to Growth
Tax History
| Year | Tax Paid | Tax Assessment Tax Assessment Total Assessment is a certain percentage of the fair market value that is determined by local assessors to be the total taxable value of land and additions on the property. | Land | Improvement |
|---|---|---|---|---|
| 2024 | $1,521 | $89,200 | $11,000 | $78,200 |
| 2023 | $1,121 | $70,506 | $11,000 | $59,506 |
| 2022 | $1,453 | $55,344 | $11,000 | $44,344 |
| 2021 | $1,375 | $55,344 | $11,000 | $44,344 |
| 2020 | $1,472 | $49,844 | $11,000 | $38,844 |
| 2019 | $1,316 | $47,844 | $9,000 | $38,844 |
| 2018 | $1,499 | $47,844 | $9,000 | $38,844 |
| 2017 | $1,298 | $45,104 | $7,200 | $37,904 |
| 2016 | $1,271 | $42,466 | $7,200 | $35,266 |
| 2015 | -- | $42,466 | $7,200 | $35,266 |
| 2014 | -- | $42,466 | $7,200 | $35,266 |
| 2013 | -- | $40,766 | $6,912 | $33,854 |
Source: Public Records
Map
Nearby Homes
- 351 Franklin Cir
- 180 Gem Dr
- 124 Colony Cir
- 1002 Cedar Creek Dr
- 183 McDonald Dr
- 17 Southshore Dr
- 66 Yellow Brick Rd
- 64 Yellow Brick Rd
- 6 Rocky Ford Rd
- 239 Flagstone Dr
- 17 Evergreen Cir
- 344 Flagstone Dr
- 18 Evergreen Cir
- 14 Evergreen Cir
- 15 Evelyn Dr
- 72 Anchor Dr
- 69 Anchor Dr
- 544 Neal Dr
- Robie Plan at Evergreen Landing
- Darwin Plan at Evergreen Landing
- 33 Stone Edge Ct
- 48 Stone Edge Ct
- 398 Colony Cir
- 386 Colony Cir
- 412 Colony Cir
- 372 Colony Cir
- 63 Spring Place Dr
- 38 Stone Edge Ct
- 464 Colony Cir
- 438 Colony Cir
- 358 Colony Cir
- 89 Spring Place Dr
- 478 Colony Cir
- 43 Spring Place Dr
- 28 Stone Edge Ct
- 490 Colony Cir
- 103 Spring Place Dr
- 373 Colony Cir
- 504 Colony Cir
- 340 Colony Cir