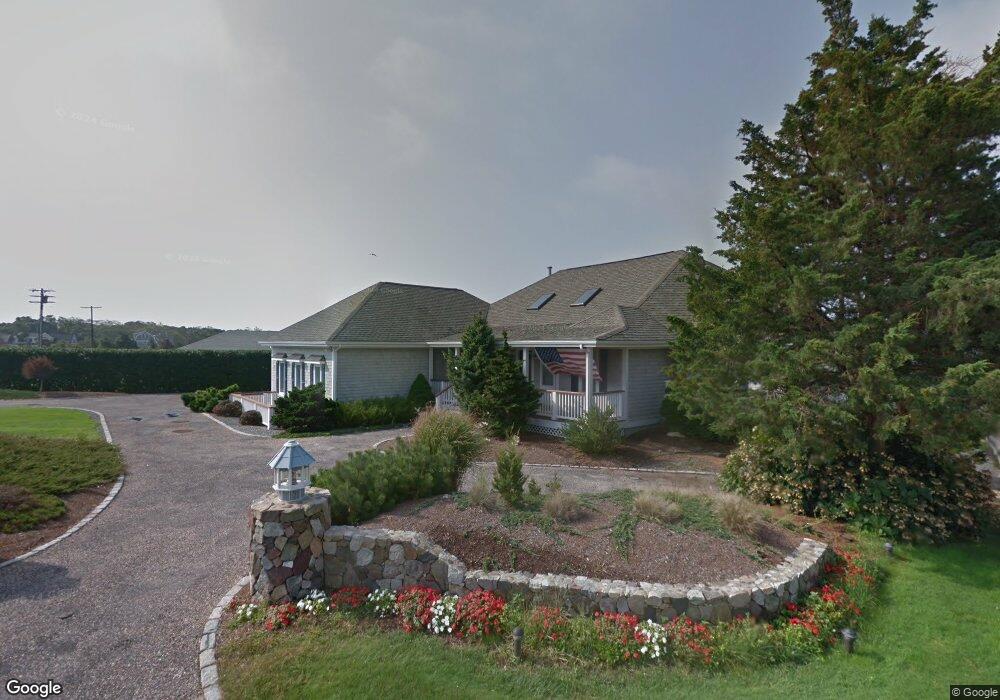
45 Sunset Point Rd North Falmouth, MA 02556
North Falmouth NeighborhoodEstimated Value: $3,997,663 - $4,975,000
4
Beds
4
Baths
5,024
Sq Ft
$879/Sq Ft
Est. Value
About This Home
This home is located at 45 Sunset Point Rd, North Falmouth, MA 02556 and is currently estimated at $4,416,166, approximately $879 per square foot. 45 Sunset Point Rd is a home located in Barnstable County with nearby schools including North Falmouth Elementary School, Morse Pond School, and Lawrence School.
Ownership History
Date
Name
Owned For
Owner Type
Purchase Details
Closed on
Apr 26, 2025
Sold by
Marie G Lebbos Lt and Lebbos
Bought by
Sunset Point Road Llc
Current Estimated Value
Purchase Details
Closed on
Sep 27, 2013
Sold by
Kaldawy Roger M and Lebbos Marie G
Bought by
Mari G Lebbos Lt and Kaldawy
Purchase Details
Closed on
Sep 23, 2013
Sold by
Gummow Clive B and Gummow Diane D
Bought by
Kaldawy Roger M and Lebbos Marie G
Purchase Details
Closed on
Oct 9, 1996
Sold by
Ma Co Inc
Bought by
Cubby Constr & Dev Inc
Home Financials for this Owner
Home Financials are based on the most recent Mortgage that was taken out on this home.
Original Mortgage
$370,000
Interest Rate
8.06%
Mortgage Type
Purchase Money Mortgage
Purchase Details
Closed on
Nov 14, 1994
Sold by
Mahoney Martin B and Massachusetts Co
Bought by
Massachusetts Co
Create a Home Valuation Report for This Property
The Home Valuation Report is an in-depth analysis detailing your home's value as well as a comparison with similar homes in the area
Home Values in the Area
Average Home Value in this Area
Purchase History
| Date | Buyer | Sale Price | Title Company |
|---|---|---|---|
| Sunset Point Road Llc | -- | None Available | |
| Mari G Lebbos Lt | -- | -- | |
| Mari G Lebbos Lt | -- | -- | |
| Kaldawy Roger M | $2,450,000 | -- | |
| Kaldawy Roger M | $2,450,000 | -- | |
| Kaldawy Roger M | $2,450,000 | -- | |
| Kaldawy Roger M | $2,450,000 | -- | |
| Cubby Constr & Dev Inc | $420,000 | -- | |
| Cubby Constr & Dev Inc | $420,000 | -- | |
| Cubby Constr & Dev Inc | $420,000 | -- | |
| Massachusetts Co | $475,000 | -- | |
| Massachusetts Co | $475,000 | -- | |
| Massachusetts Co | $475,000 | -- |
Source: Public Records
Mortgage History
| Date | Status | Borrower | Loan Amount |
|---|---|---|---|
| Previous Owner | Cubby Constr & Dev Inc | $370,000 | |
| Closed | Kaldawy Roger M | $0 |
Source: Public Records
Tax History Compared to Growth
Tax History
| Year | Tax Paid | Tax Assessment Tax Assessment Total Assessment is a certain percentage of the fair market value that is determined by local assessors to be the total taxable value of land and additions on the property. | Land | Improvement |
|---|---|---|---|---|
| 2025 | $21,532 | $3,668,100 | $2,390,600 | $1,277,500 |
| 2024 | $21,723 | $3,459,100 | $2,274,300 | $1,184,800 |
| 2023 | $22,133 | $3,198,400 | $2,274,300 | $924,100 |
| 2022 | $21,760 | $2,703,100 | $1,896,900 | $806,200 |
| 2021 | $21,717 | $2,554,900 | $1,814,400 | $740,500 |
| 2020 | $19,962 | $2,323,900 | $1,649,500 | $674,400 |
| 2019 | $19,844 | $2,318,200 | $1,649,500 | $668,700 |
| 2018 | $19,735 | $2,294,800 | $1,649,500 | $645,300 |
| 2017 | $19,432 | $2,278,100 | $1,649,500 | $628,600 |
| 2016 | $19,064 | $2,277,700 | $1,649,500 | $628,200 |
| 2015 | $18,654 | $2,277,700 | $1,649,500 | $628,200 |
| 2014 | $18,224 | $2,236,100 | $1,649,500 | $586,600 |
Source: Public Records
Map
Nearby Homes
- 24 Westwood Rd
- 40 Point Rd
- 9 Seascape Ln
- 37 Five Gate Ln
- 74 Hillside Ave
- 24 Fiddlers Cove Rd
- 14 Ryder Rd
- 2 Tricia Rd
- 0 Quaker Rd Unit 22504204
- 0 Quaker Rd Unit 73423088
- 345 Quaker Rd
- 250 Scraggy Neck Rd
- 48 Garnet Ave
- 289 Old Main Rd
- 267 N Falmouth Hwy
- 213 N Falmouth Hwy Unit 5A
- 213 N Falmouth Hwy Unit 5B
- 213 N Falmouth Hwy Unit 5 A
- 75 Winsor Rd
- 62 Westwood Rd
- 41 Sunset Point Rd
- 48 Sunset Point Rd
- 69 Westwood Rd
- 58 Westwood Rd
- 35 Sunset Point Rd
- 61 Westwood Rd
- 75 Westwood Rd
- 2 Sunset Point Rd
- 55 Westwood Rd
- 31 Sunset Point Rd
- 12 Sunset Point Rd
- 17 Arch Rd
- 15 Arch Rd
- 50 Westwood Rd
- 81 Westwood Rd
- 39 Loren Rd
- 11 Arch Rd
- 87 Westwood Rd
- 25 Sunset Point Rd