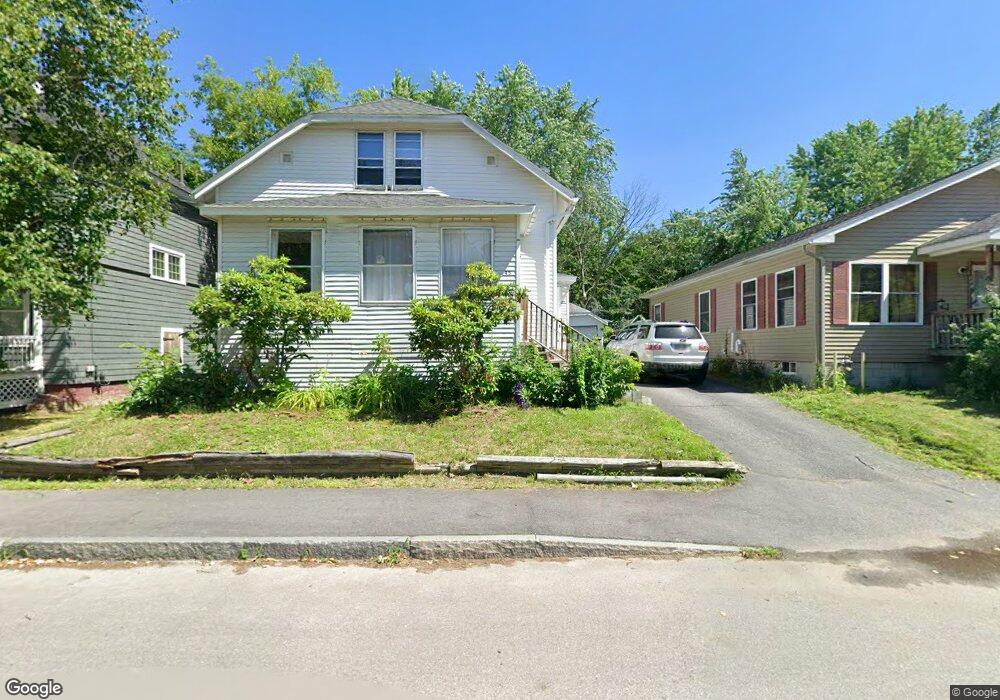
45 Sylvan Ave Lewiston, ME 04240
Estimated Value: $249,000 - $397,000
5
Beds
2
Baths
1,310
Sq Ft
$232/Sq Ft
Est. Value
About This Home
This home is located at 45 Sylvan Ave, Lewiston, ME 04240 and is currently estimated at $303,341, approximately $231 per square foot. 45 Sylvan Ave is a home located in Androscoggin County with nearby schools including Farwell Elementary School, Lewiston Middle School, and Lewiston High School.
Ownership History
Date
Name
Owned For
Owner Type
Purchase Details
Closed on
Apr 2, 2020
Sold by
Sandman Llc
Bought by
Marion Capital Llc
Current Estimated Value
Home Financials for this Owner
Home Financials are based on the most recent Mortgage that was taken out on this home.
Original Mortgage
$65,000
Outstanding Balance
$57,332
Interest Rate
3.4%
Mortgage Type
New Conventional
Estimated Equity
$246,009
Purchase Details
Closed on
Jan 8, 2020
Sold by
Truist Bank and Tougas
Bought by
Sandman Llc
Purchase Details
Closed on
Jul 12, 2005
Sold by
Bakhshandeh Bahram and Ahmadi Ferouzeh
Bought by
Tougas Damien U
Home Financials for this Owner
Home Financials are based on the most recent Mortgage that was taken out on this home.
Original Mortgage
$153,750
Interest Rate
5.71%
Mortgage Type
FHA
Create a Home Valuation Report for This Property
The Home Valuation Report is an in-depth analysis detailing your home's value as well as a comparison with similar homes in the area
Home Values in the Area
Average Home Value in this Area
Purchase History
| Date | Buyer | Sale Price | Title Company |
|---|---|---|---|
| Marion Capital Llc | -- | None Available | |
| Marion Capital Llc | -- | None Available | |
| Sandman Llc | -- | None Available | |
| Sandman Llc | -- | None Available | |
| Tougas Damien U | -- | -- | |
| Tougas Damien U | -- | -- | |
| Tougas Damien U | -- | -- |
Source: Public Records
Mortgage History
| Date | Status | Borrower | Loan Amount |
|---|---|---|---|
| Open | Marion Capital Llc | $65,000 | |
| Closed | Marion Capital Llc | $65,000 | |
| Previous Owner | Tougas Damien U | $153,750 |
Source: Public Records
Tax History Compared to Growth
Tax History
| Year | Tax Paid | Tax Assessment Tax Assessment Total Assessment is a certain percentage of the fair market value that is determined by local assessors to be the total taxable value of land and additions on the property. | Land | Improvement |
|---|---|---|---|---|
| 2025 | $2,972 | $90,660 | $13,440 | $77,220 |
| 2024 | $2,880 | $90,660 | $13,440 | $77,220 |
| 2023 | $2,720 | $90,660 | $13,440 | $77,220 |
| 2022 | $2,584 | $90,660 | $13,440 | $77,220 |
| 2021 | $2,562 | $90,660 | $13,440 | $77,220 |
| 2020 | $2,599 | $90,660 | $13,440 | $77,220 |
| 2019 | $2,621 | $90,660 | $13,440 | $77,220 |
| 2018 | $2,599 | $90,660 | $13,440 | $77,220 |
| 2017 | $2,540 | $90,660 | $13,440 | $77,220 |
| 2016 | $2,497 | $90,660 | $13,440 | $77,220 |
| 2015 | $2,481 | $90,660 | $13,440 | $77,220 |
| 2014 | $2,411 | $90,660 | $13,440 | $77,220 |
| 2013 | $2,397 | $90,660 | $13,440 | $77,220 |
Source: Public Records
Map
Nearby Homes