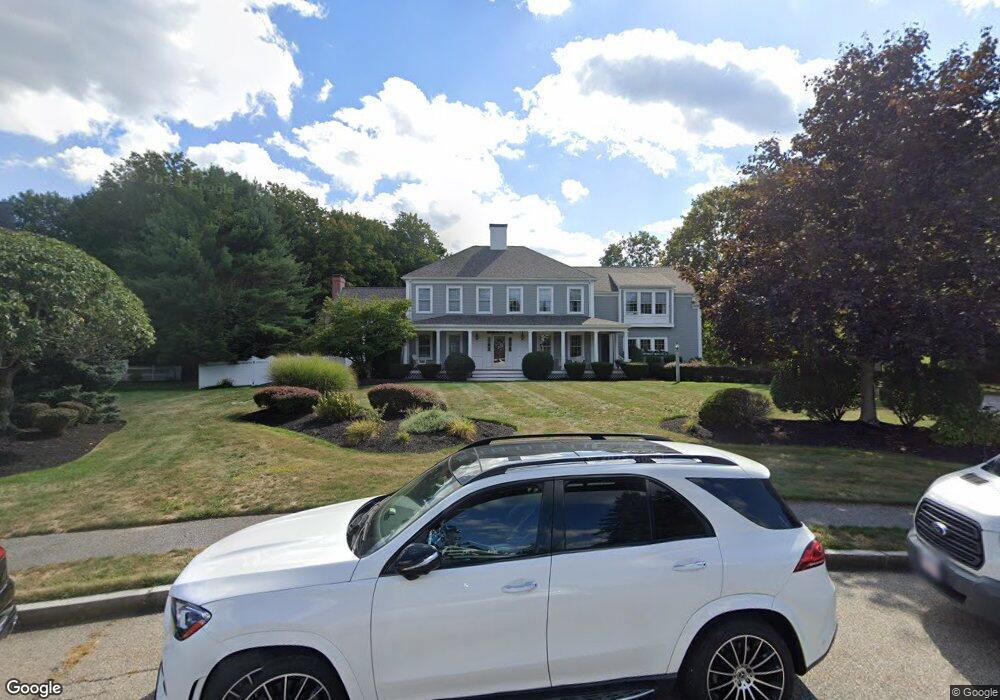
45 Thorney Meadow Way Hanover, MA 02339
Estimated Value: $1,336,000 - $1,615,000
4
Beds
3
Baths
3,535
Sq Ft
$413/Sq Ft
Est. Value
About This Home
This home is located at 45 Thorney Meadow Way, Hanover, MA 02339 and is currently estimated at $1,460,964, approximately $413 per square foot. 45 Thorney Meadow Way is a home located in Plymouth County with nearby schools including Hanover High School, Calvary Chapel Academy, and Holy Family Elementary School.
Ownership History
Date
Name
Owned For
Owner Type
Purchase Details
Closed on
Sep 13, 1996
Sold by
Homestead Rt and Gallagher Paul T
Bought by
Connolly David B and Connolly Christine M
Current Estimated Value
Create a Home Valuation Report for This Property
The Home Valuation Report is an in-depth analysis detailing your home's value as well as a comparison with similar homes in the area
Home Values in the Area
Average Home Value in this Area
Purchase History
| Date | Buyer | Sale Price | Title Company |
|---|---|---|---|
| Connolly David B | $157,500 | -- |
Source: Public Records
Mortgage History
| Date | Status | Borrower | Loan Amount |
|---|---|---|---|
| Open | Connolly David B | $293,000 | |
| Closed | Connolly David B | $300,000 | |
| Closed | Connolly David B | $200,000 |
Source: Public Records
Tax History Compared to Growth
Tax History
| Year | Tax Paid | Tax Assessment Tax Assessment Total Assessment is a certain percentage of the fair market value that is determined by local assessors to be the total taxable value of land and additions on the property. | Land | Improvement |
|---|---|---|---|---|
| 2025 | $16,337 | $1,322,800 | $354,300 | $968,500 |
| 2024 | $15,792 | $1,229,900 | $354,300 | $875,600 |
| 2023 | $16,143 | $1,196,700 | $322,700 | $874,000 |
| 2022 | $14,494 | $950,400 | $284,500 | $665,900 |
| 2021 | $32 | $895,200 | $259,100 | $636,100 |
| 2020 | $4,798 | $867,600 | $259,100 | $608,500 |
| 2019 | $4,757 | $852,000 | $282,300 | $569,700 |
| 2018 | $12,978 | $797,200 | $282,300 | $514,900 |
| 2017 | $3,353 | $802,500 | $282,100 | $520,400 |
| 2016 | $12,910 | $765,700 | $256,800 | $508,900 |
| 2015 | $12,366 | $765,700 | $256,800 | $508,900 |
Source: Public Records
Map
Nearby Homes
- 51 Thorney Meadow Way
- 39 Thorney Meadow Way
- 54 Thorney Meadow Way
- 83 Whiting St
- 79 Whiting St
- 91 Whiting St
- 22 Thorney Meadow Way
- 27 Thorney Meadow Way
- 48 Thorney Meadow Way
- 71 Whiting St
- 17 Thorney Meadow Way
- 88 Whiting St
- 88 Whiting St Unit 1
- 10 Thorney Meadow Way
- 76 Whiting St
- 131 Homestead Ln
- 100 Whiting St
- 111 Whiting St
- 103 Homestead Ln
- 65 Homestead Ln