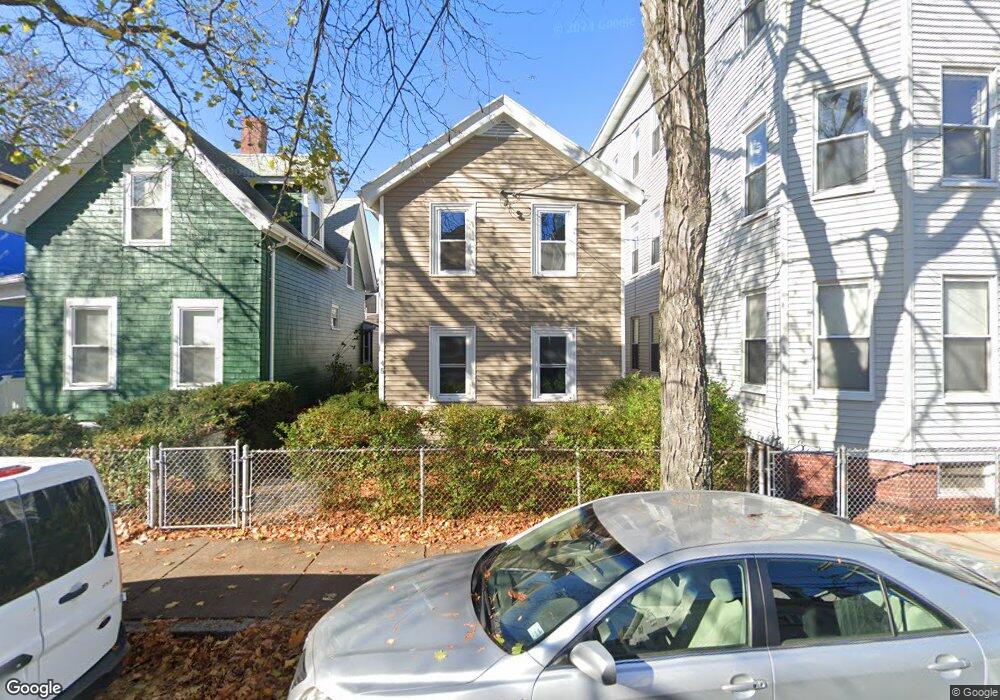
45 Tremont St Cambridge, MA 02139
The Port NeighborhoodEstimated Value: $1,335,000 - $1,508,983
3
Beds
2
Baths
1,400
Sq Ft
$1,034/Sq Ft
Est. Value
About This Home
This home is located at 45 Tremont St, Cambridge, MA 02139 and is currently estimated at $1,446,996, approximately $1,033 per square foot. 45 Tremont St is a home located in Middlesex County with nearby schools including Prospect Hill Academy Charter School.
Ownership History
Date
Name
Owned For
Owner Type
Purchase Details
Closed on
Jul 18, 2019
Sold by
Hiari Khaled E
Bought by
Hiari Jennah R and Hiari Khaled E
Current Estimated Value
Purchase Details
Closed on
Apr 14, 2017
Sold by
Hiari Jennah R
Bought by
Hiari Khaled E
Purchase Details
Closed on
Aug 27, 2012
Sold by
Mullane Paula
Bought by
Hiari Jennah R and Hiari Khaled E
Create a Home Valuation Report for This Property
The Home Valuation Report is an in-depth analysis detailing your home's value as well as a comparison with similar homes in the area
Home Values in the Area
Average Home Value in this Area
Purchase History
| Date | Buyer | Sale Price | Title Company |
|---|---|---|---|
| Hiari Jennah R | -- | -- | |
| Hiari Khaled E | -- | -- | |
| Hiari Jennah R | -- | -- |
Source: Public Records
Tax History Compared to Growth
Tax History
| Year | Tax Paid | Tax Assessment Tax Assessment Total Assessment is a certain percentage of the fair market value that is determined by local assessors to be the total taxable value of land and additions on the property. | Land | Improvement |
|---|---|---|---|---|
| 2025 | $8,491 | $1,337,100 | $667,100 | $670,000 |
| 2024 | $8,062 | $1,361,800 | $720,600 | $641,200 |
| 2023 | $7,614 | $1,299,300 | $732,700 | $566,600 |
| 2022 | $7,305 | $1,233,900 | $732,900 | $501,000 |
| 2021 | $6,927 | $1,184,100 | $718,800 | $465,300 |
| 2020 | $6,659 | $1,158,100 | $717,700 | $440,400 |
| 2019 | $6,092 | $1,025,600 | $629,900 | $395,700 |
| 2018 | $5,782 | $919,300 | $542,100 | $377,200 |
| 2017 | $5,435 | $837,400 | $484,600 | $352,800 |
| 2016 | $5,082 | $727,100 | $405,800 | $321,300 |
| 2015 | $3,530 | $451,400 | $339,200 | $112,200 |
| 2014 | $3,434 | $409,800 | $272,600 | $137,200 |
Source: Public Records
Map
Nearby Homes
- 31 Tremont St
- 196 Prospect St
- 190 Prospect St Unit 8
- 244 Norfolk St Unit 244
- 305 Broadway
- 142 Amory St Unit Front
- 114 Elm St
- 66 Elm St
- 114 Inman St Unit 3
- 308 Broadway Unit 308
- 51 Market St Unit 2
- 222 Columbia St Unit 2
- 30 Union St Unit 1
- 161 Columbia St Unit 3
- 276 Harvard St Unit 7
- 94 Hampshire St Unit B
- 43 Lincoln St
- 75 Fayette St Unit 3
- 280 Harvard St Unit 1A
- 350 Windsor St Unit 1
- 45 Tremont St Unit 1
- 43 Tremont St
- 47 Tremont St
- 47 Tremont St Unit 2
- 47 Tremont St
- 47 Tremont St Unit 1
- 12 Murdock St
- 10 Murdock St
- 14 Murdock St
- 14 Murdock St
- 14 Murdock St Unit 3
- 41 Tremont St
- 16 Murdock St
- 16 Murdock St Unit 2
- 16 Murdock St Unit 16
- 18 Murdock St Unit 18
- 156 Hampshire St
- 156 Hampshire St Unit 2
- 156 Hampshire St Unit 1
- 39 Tremont St