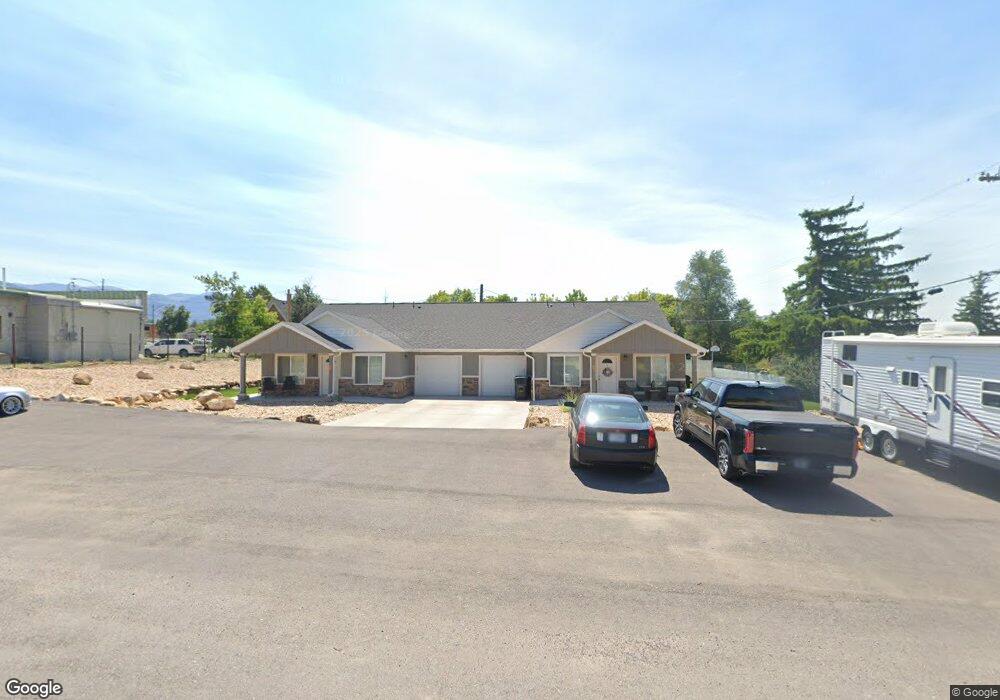
45 W 200 N Mount Pleasant, UT 84647
Estimated Value: $409,000
--
Bed
--
Bath
2,500
Sq Ft
$164/Sq Ft
Est. Value
About This Home
This home is located at 45 W 200 N, Mount Pleasant, UT 84647 and is currently estimated at $409,000, approximately $163 per square foot. 45 W 200 N is a home located in Sanpete County with nearby schools including North Sanpete High School and Wasatch Academy.
Ownership History
Date
Name
Owned For
Owner Type
Purchase Details
Closed on
Jan 1, 2021
Sold by
Beck Brian
Bought by
Lmi Properties Llc
Current Estimated Value
Purchase Details
Closed on
Jul 31, 2017
Sold by
Sbd Props Llc
Bought by
Beck Brian
Home Financials for this Owner
Home Financials are based on the most recent Mortgage that was taken out on this home.
Original Mortgage
$141,773
Interest Rate
3.91%
Mortgage Type
New Conventional
Purchase Details
Closed on
Sep 2, 2008
Sold by
Mikkelsen Bret and Mikkelsen Kristie
Bought by
Birch Creek Enterprises Llc
Create a Home Valuation Report for This Property
The Home Valuation Report is an in-depth analysis detailing your home's value as well as a comparison with similar homes in the area
Home Values in the Area
Average Home Value in this Area
Purchase History
| Date | Buyer | Sale Price | Title Company |
|---|---|---|---|
| Lmi Properties Llc | -- | -- | |
| Beck Brian | -- | -- | |
| Birch Creek Enterprises Llc | -- | Central Utah Title |
Source: Public Records
Mortgage History
| Date | Status | Borrower | Loan Amount |
|---|---|---|---|
| Previous Owner | Beck Brian | $141,773 |
Source: Public Records
Tax History Compared to Growth
Tax History
| Year | Tax Paid | Tax Assessment Tax Assessment Total Assessment is a certain percentage of the fair market value that is determined by local assessors to be the total taxable value of land and additions on the property. | Land | Improvement |
|---|---|---|---|---|
| 2024 | $2,131 | $227,016 | $0 | $0 |
| 2023 | $2,079 | $213,161 | $0 | $0 |
| 2022 | $2,102 | $192,194 | $0 | $0 |
| 2021 | $1,784 | $147,985 | $0 | $0 |
| 2020 | $1,676 | $126,745 | $0 | $0 |
| 2019 | $1,652 | $117,620 | $0 | $0 |
| 2018 | $1,515 | $185,960 | $23,115 | $162,845 |
| 2017 | $338 | $23,115 | $0 | $0 |
| 2016 | $307 | $21,014 | $0 | $0 |
| 2015 | $309 | $21,014 | $0 | $0 |
| 2014 | $316 | $21,014 | $0 | $0 |
| 2013 | $297 | $21,014 | $0 | $0 |
Source: Public Records
Map
Nearby Homes