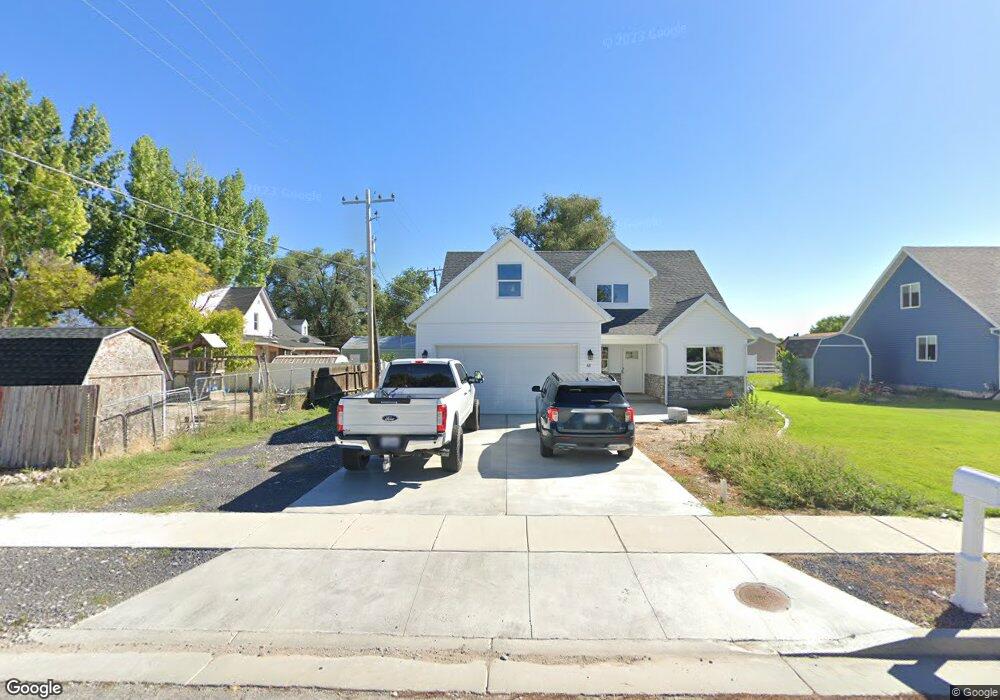
45 W 700 S Garland, UT 84312
Estimated Value: $444,000 - $491,000
4
Beds
3
Baths
2,074
Sq Ft
$224/Sq Ft
Est. Value
About This Home
This home is located at 45 W 700 S, Garland, UT 84312 and is currently estimated at $464,705, approximately $224 per square foot. 45 W 700 S is a home located in Box Elder County with nearby schools including Garland School, Bear River Middle School, and Alice C. Harris Intermediate School.
Ownership History
Date
Name
Owned For
Owner Type
Purchase Details
Closed on
Oct 29, 2024
Sold by
Hillis Shawn W and Hillis Erika
Bought by
Obanion Craig and Obanion Colleen
Current Estimated Value
Purchase Details
Closed on
Mar 16, 2022
Sold by
Eddings William B
Bought by
Freedom Farms Inc
Purchase Details
Closed on
Nov 12, 2020
Sold by
Eddings William and Eddings Richelle
Bought by
Freedom Farms Inc
Home Financials for this Owner
Home Financials are based on the most recent Mortgage that was taken out on this home.
Original Mortgage
$260,000
Interest Rate
2.8%
Mortgage Type
Commercial
Create a Home Valuation Report for This Property
The Home Valuation Report is an in-depth analysis detailing your home's value as well as a comparison with similar homes in the area
Home Values in the Area
Average Home Value in this Area
Purchase History
| Date | Buyer | Sale Price | Title Company |
|---|---|---|---|
| Obanion Craig | -- | None Listed On Document | |
| Freedom Farms Inc | -- | Pinnacle Title | |
| Freedom Farms Inc | -- | Pinnacle Title |
Source: Public Records
Mortgage History
| Date | Status | Borrower | Loan Amount |
|---|---|---|---|
| Previous Owner | Freedom Farms Inc | $260,000 |
Source: Public Records
Tax History Compared to Growth
Tax History
| Year | Tax Paid | Tax Assessment Tax Assessment Total Assessment is a certain percentage of the fair market value that is determined by local assessors to be the total taxable value of land and additions on the property. | Land | Improvement |
|---|---|---|---|---|
| 2025 | $2,783 | $424,421 | $110,000 | $314,421 |
| 2024 | $2,465 | $423,277 | $105,000 | $318,277 |
| 2023 | $2,963 | $498,955 | $100,000 | $398,955 |
| 2022 | $2,815 | $444,238 | $35,000 | $409,238 |
| 2021 | $521 | $41,377 | $35,000 | $6,377 |
| 2020 | $541 | $41,377 | $35,000 | $6,377 |
| 2019 | $416 | $30,643 | $25,000 | $5,643 |
| 2018 | $363 | $25,000 | $25,000 | $0 |
| 2017 | $377 | $25,000 | $25,000 | $0 |
| 2016 | $371 | $25,000 | $25,000 | $0 |
| 2015 | $387 | $25,000 | $25,000 | $0 |
| 2014 | $387 | $25,000 | $25,000 | $0 |
| 2013 | -- | $15,980 | $15,980 | $0 |
Source: Public Records
Map
Nearby Homes