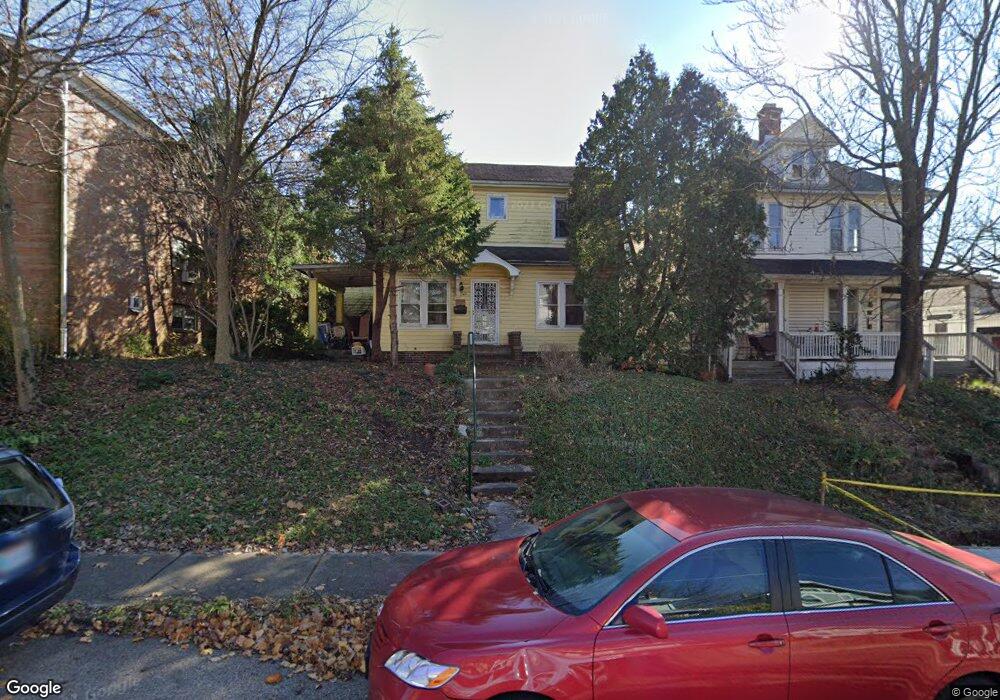
45 W Duncan St Columbus, OH 43202
Old North Columbus NeighborhoodEstimated Value: $270,124 - $302,000
3
Beds
1
Bath
1,484
Sq Ft
$194/Sq Ft
Est. Value
About This Home
This home is located at 45 W Duncan St, Columbus, OH 43202 and is currently estimated at $287,531, approximately $193 per square foot. 45 W Duncan St is a home located in Franklin County with nearby schools including Clinton Elementary School, Dominion Middle School, and Whetstone High School.
Ownership History
Date
Name
Owned For
Owner Type
Purchase Details
Closed on
Jul 13, 1984
Bought by
Ioia Maxine E S
Current Estimated Value
Create a Home Valuation Report for This Property
The Home Valuation Report is an in-depth analysis detailing your home's value as well as a comparison with similar homes in the area
Home Values in the Area
Average Home Value in this Area
Purchase History
| Date | Buyer | Sale Price | Title Company |
|---|---|---|---|
| Ioia Maxine E S | -- | -- |
Source: Public Records
Tax History Compared to Growth
Tax History
| Year | Tax Paid | Tax Assessment Tax Assessment Total Assessment is a certain percentage of the fair market value that is determined by local assessors to be the total taxable value of land and additions on the property. | Land | Improvement |
|---|---|---|---|---|
| 2024 | $3,247 | $72,350 | $46,970 | $25,380 |
| 2023 | $3,206 | $72,345 | $46,970 | $25,375 |
| 2022 | $2,051 | $39,520 | $17,680 | $21,840 |
| 2021 | $2,053 | $39,520 | $17,680 | $21,840 |
| 2020 | $2,056 | $39,520 | $17,680 | $21,840 |
| 2019 | $2,397 | $39,520 | $17,680 | $21,840 |
| 2018 | $2,545 | $44,840 | $17,680 | $27,160 |
| 2017 | $2,668 | $44,840 | $17,680 | $27,160 |
| 2016 | $2,618 | $39,520 | $15,650 | $23,870 |
| 2015 | $2,376 | $39,520 | $15,650 | $23,870 |
| 2014 | $2,382 | $39,520 | $15,650 | $23,870 |
| 2013 | $1,176 | $39,550 | $14,910 | $24,640 |
Source: Public Records
Map
Nearby Homes
- 2627 Neil Ave
- 2683 Neil Ave Unit 685
- 69-71 E Duncan St
- 116-118 E Hudson St
- 6 E Blake Ave
- 109-117 E Arcadia Ave
- 185 E Tompkins St
- 2537 Medary Ave Unit 539
- 116 Olentangy Point Unit J116
- 198 E Maynard Ave
- 2584 Deming Ave
- 241 E Blake Ave
- 223-225 E Maynard Ave
- 2680 Deming Ave
- 270 E Kelso Rd
- 9 E Norwich Ave Unit 15
- 203 E Tulane Rd
- 360-364 E Tompkins St
- 45 Tibet Rd
- 3021 N High St
- 45 E Duncan St
- 35 W Duncan St
- 49 W Duncan St Unit 51
- 55 W Duncan St
- 2596 Neil Ave
- 2596 Neil Ave
- 2596 Neil Ave
- 2596 Neil Ave
- 2596 Neil Ave Unit D
- 2596 Neil Ave Unit C
- 2596 Neil Ave Unit A
- 2596 Neil Ave Unit B
- 2602 Neil Ave
- 2602 Neil Ave
- 2602 Neil Ave
- 2602 Neil Ave Unit 2602D
- 2602 Neil Ave Unit C
- 2602 Neil Ave Unit A
- 2602 Neil Ave Unit D
- 2602 Neil Ave Unit B