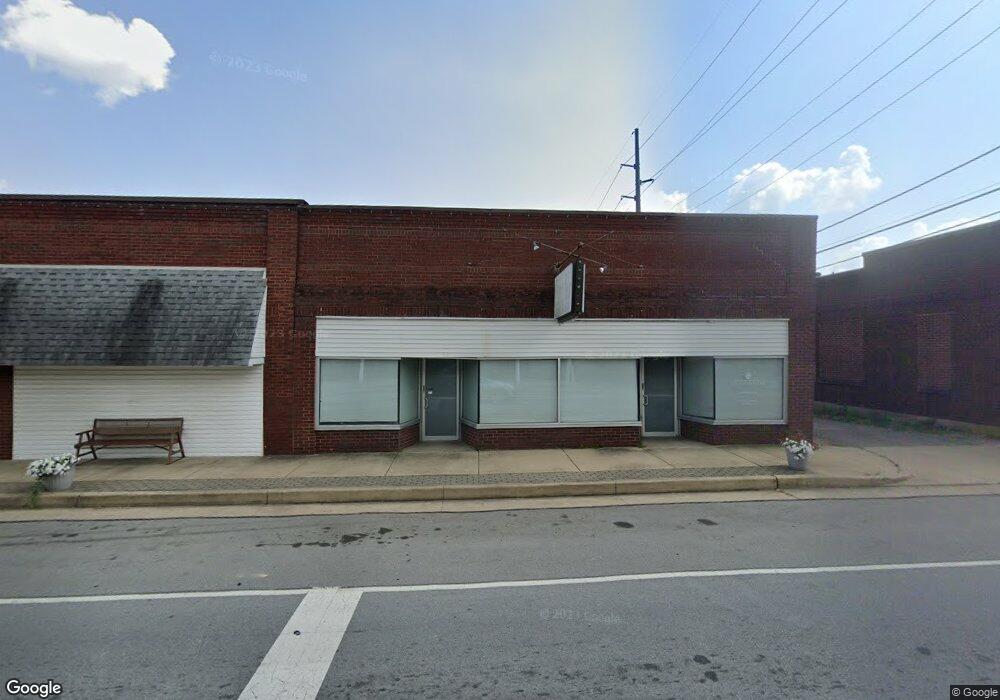
45 W Main St Austin, IN 47102
--
Bed
--
Bath
3,200
Sq Ft
4,356
Sq Ft Lot
About This Home
This home is located at 45 W Main St, Austin, IN 47102. 45 W Main St is a home located in Scott County with nearby schools including Austin Elementary School, Austin Middle School, and Austin High School.
Ownership History
Date
Name
Owned For
Owner Type
Purchase Details
Closed on
Sep 12, 2017
Sold by
Jmh Indiana Properties Llc
Bought by
Knobstone Development Group Inc
Purchase Details
Closed on
Jun 5, 2012
Sold by
Not Provided
Bought by
Stewart Jeffery M and Stewart Theresa M
Purchase Details
Closed on
May 27, 2005
Sold by
Wilson Robert B and Wilson Norma J
Bought by
Harris Jeffery and Harris Julie
Home Financials for this Owner
Home Financials are based on the most recent Mortgage that was taken out on this home.
Original Mortgage
$166,500
Interest Rate
5.82%
Mortgage Type
Commercial
Create a Home Valuation Report for This Property
The Home Valuation Report is an in-depth analysis detailing your home's value as well as a comparison with similar homes in the area
Home Values in the Area
Average Home Value in this Area
Purchase History
| Date | Buyer | Sale Price | Title Company |
|---|---|---|---|
| Knobstone Development Group Inc | -- | None Available | |
| Stewart Jeffery M | $68,000 | -- | |
| Stewart Jeffery | $68,000 | None Available | |
| Harris Jeffery | -- | None Available |
Source: Public Records
Mortgage History
| Date | Status | Borrower | Loan Amount |
|---|---|---|---|
| Previous Owner | Harris Jeffery | $166,500 |
Source: Public Records
Tax History Compared to Growth
Tax History
| Year | Tax Paid | Tax Assessment Tax Assessment Total Assessment is a certain percentage of the fair market value that is determined by local assessors to be the total taxable value of land and additions on the property. | Land | Improvement |
|---|---|---|---|---|
| 2024 | $1,798 | $52,100 | $8,100 | $44,000 |
| 2023 | $1,935 | $53,100 | $8,100 | $45,000 |
| 2022 | $1,719 | $53,600 | $8,100 | $45,500 |
| 2021 | $1,533 | $49,900 | $8,100 | $41,800 |
| 2020 | $870 | $29,000 | $8,100 | $20,900 |
| 2019 | $870 | $29,000 | $8,100 | $20,900 |
| 2018 | $864 | $28,800 | $8,100 | $20,700 |
| 2017 | $858 | $28,600 | $8,100 | $20,500 |
| 2016 | $852 | $28,400 | $8,100 | $20,300 |
| 2014 | $840 | $28,000 | $8,100 | $19,900 |
| 2013 | $840 | $46,800 | $6,900 | $39,900 |
Source: Public Records
Map
Nearby Homes