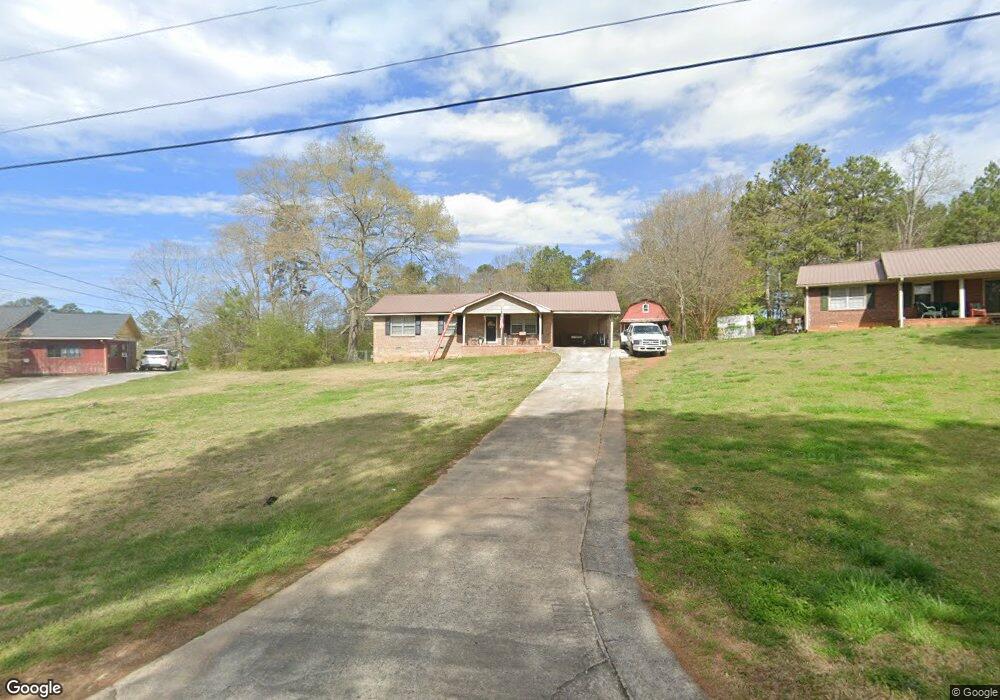
45 Walker Way Cedartown, GA 30125
Estimated Value: $29,000 - $217,000
3
Beds
1
Bath
950
Sq Ft
$151/Sq Ft
Est. Value
About This Home
This home is located at 45 Walker Way, Cedartown, GA 30125 and is currently estimated at $143,589, approximately $151 per square foot. 45 Walker Way is a home located in Polk County with nearby schools including Cedar Christian School.
Ownership History
Date
Name
Owned For
Owner Type
Purchase Details
Closed on
Jul 9, 2025
Sold by
Liepelt Robert William
Bought by
Liepelt William C
Current Estimated Value
Purchase Details
Closed on
Nov 19, 2004
Sold by
Secretary Of Housing & Urban Development
Bought by
Liepelt Robert William
Purchase Details
Closed on
Jun 1, 2004
Sold by
Mortgage Electronic Registration Systems
Bought by
Secretary Of Housing & Urban Development
Purchase Details
Closed on
Apr 4, 2001
Sold by
Davidson John W and Davidson Ruby C
Bought by
Combs Alan B and Combs Karen N
Purchase Details
Closed on
Nov 1, 1994
Sold by
Weatherby Kala S
Bought by
Davidson John W and Davidson Ruby C
Purchase Details
Closed on
Sep 24, 1993
Sold by
Weatherby Gregory J
Bought by
Weatherby Kala S
Purchase Details
Closed on
Apr 13, 1979
Sold by
Laurie Joe Homes Inc
Bought by
Weatherby Gregory
Purchase Details
Closed on
Dec 21, 1978
Sold by
Southern Land Broker
Bought by
Laurie Joe Homes Inc
Purchase Details
Closed on
May 31, 1977
Bought by
Southern Land Broker
Create a Home Valuation Report for This Property
The Home Valuation Report is an in-depth analysis detailing your home's value as well as a comparison with similar homes in the area
Purchase History
| Date | Buyer | Sale Price | Title Company |
|---|---|---|---|
| Liepelt William C | $29,692 | -- | |
| Liepelt Robert William | -- | -- | |
| Secretary Of Housing & Urban Development | -- | -- | |
| Mortgage Electronic Registration Systems | -- | -- | |
| Combs Alan B | $73,000 | -- | |
| Davidson John W | $39,900 | -- | |
| Weatherby Kala S | -- | -- | |
| Weatherby Gregory | -- | -- | |
| Laurie Joe Homes Inc | -- | -- | |
| Southern Land Broker | -- | -- |
Source: Public Records
Tax History
| Year | Tax Paid | Tax Assessment Tax Assessment Total Assessment is a certain percentage of the fair market value that is determined by local assessors to be the total taxable value of land and additions on the property. | Land | Improvement |
|---|---|---|---|---|
| 2025 | $1,030 | $45,765 | $10,000 | $35,765 |
| 2024 | $970 | $46,420 | $10,000 | $36,420 |
| 2023 | $761 | $32,052 | $8,000 | $24,052 |
| 2022 | $592 | $24,956 | $4,000 | $20,956 |
| 2021 | $600 | $24,956 | $4,000 | $20,956 |
| 2020 | $601 | $24,956 | $4,000 | $20,956 |
| 2019 | $576 | $21,451 | $2,400 | $19,051 |
| 2018 | $576 | $20,897 | $2,400 | $18,497 |
| 2017 | $569 | $20,897 | $2,400 | $18,497 |
| 2016 | $569 | $20,897 | $2,400 | $18,497 |
| 2015 | $575 | $21,055 | $2,400 | $18,655 |
| 2014 | $579 | $21,055 | $2,400 | $18,655 |
Source: Public Records
Map
Nearby Homes
- 55 Lovvorn Rd
- 232 Tuck St
- 117 Cason Rd
- 117 Hicklen Dr
- 00 Buchanan Hwy
- 0 Irwin St Unit 7705350
- 1327 Brooks St
- 77 Morris Dr
- 95 Wieuca Way
- 567 Morton Springs Rd
- 142 Acres On Judkin Mill Rd
- TRACT2 Wieuca Way
- 000 Wieuca Way
- 129 W Ellawood Ave
- 0 Wieuca Way Unit 10614129
- 1003 Fairview Ave
- 873 E Point Rd
- 00 Juliette St
- 0 Coaling Rd Unit 9221-D 10352096
- 0 Coaling Rd Unit 9221-C 10352086
Your Personal Tour Guide
Ask me questions while you tour the home.