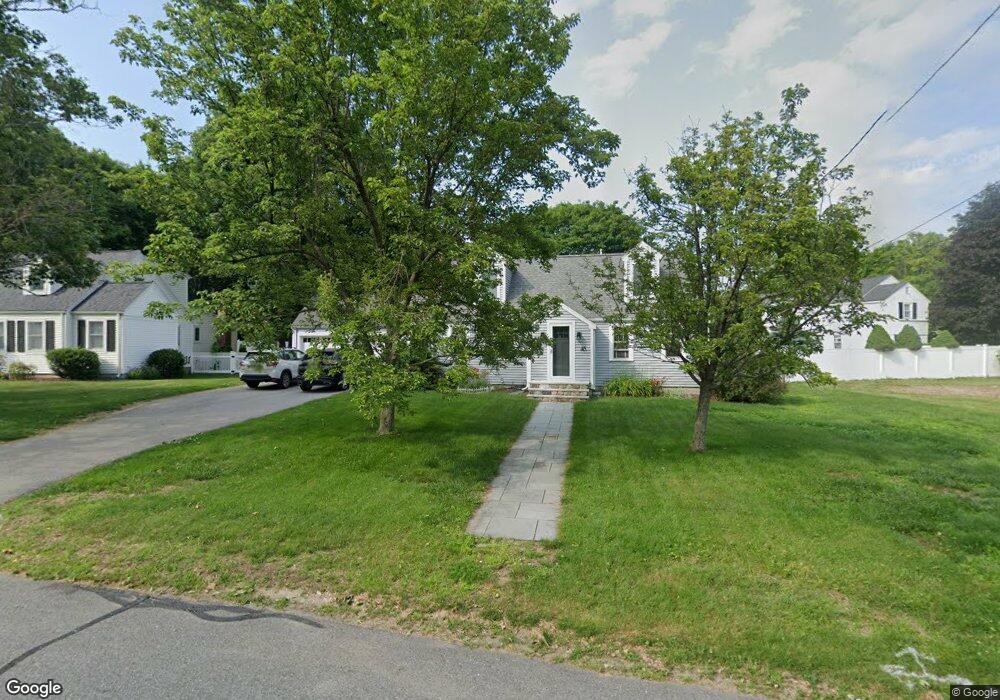
45 Warwick Dr Westwood, MA 02090
Estimated Value: $1,077,000 - $1,370,000
3
Beds
3
Baths
2,169
Sq Ft
$573/Sq Ft
Est. Value
About This Home
This home is located at 45 Warwick Dr, Westwood, MA 02090 and is currently estimated at $1,243,505, approximately $573 per square foot. 45 Warwick Dr is a home located in Norfolk County with nearby schools including Westwood High School, St Catherine Of Siena School, and Xaverian Brothers High School.
Ownership History
Date
Name
Owned For
Owner Type
Purchase Details
Closed on
Oct 3, 2025
Sold by
Campbell Martha E and Campbell Jeffrey D
Bought by
Martha E Campbell Lt and Campbell
Current Estimated Value
Purchase Details
Closed on
May 10, 2002
Sold by
Steinkrauss Kurt R and Steinkrauss Julie C
Bought by
Campbell Jeffrey D and Campbell Martha E
Purchase Details
Closed on
May 20, 1999
Sold by
Kearns Kevin J and Kearns Donna
Bought by
Steinkrauss Kurt R and Steinkrauss Julie C
Purchase Details
Closed on
Mar 26, 1996
Sold by
Johnson Christopher M and Johnson Ellen P
Bought by
Kearns Kevin J and Kearns Donna
Purchase Details
Closed on
Nov 29, 1991
Sold by
Almeida Robert F and Almeida Mary A
Bought by
Johnson Christopher M and Johnson Ellen P
Purchase Details
Closed on
Feb 16, 1990
Sold by
Kelly Admr John W
Bought by
Flynn Mary A
Create a Home Valuation Report for This Property
The Home Valuation Report is an in-depth analysis detailing your home's value as well as a comparison with similar homes in the area
Home Values in the Area
Average Home Value in this Area
Purchase History
| Date | Buyer | Sale Price | Title Company |
|---|---|---|---|
| Martha E Campbell Lt | -- | -- | |
| Campbell Jeffrey D | $460,000 | -- | |
| Campbell Jeffrey D | $460,000 | -- | |
| Steinkrauss Kurt R | $341,000 | -- | |
| Kearns Kevin J | $285,000 | -- | |
| Johnson Christopher M | $193,000 | -- | |
| Flynn Mary A | $184,000 | -- |
Source: Public Records
Mortgage History
| Date | Status | Borrower | Loan Amount |
|---|---|---|---|
| Previous Owner | Flynn Mary A | $486,000 |
Source: Public Records
Tax History Compared to Growth
Tax History
| Year | Tax Paid | Tax Assessment Tax Assessment Total Assessment is a certain percentage of the fair market value that is determined by local assessors to be the total taxable value of land and additions on the property. | Land | Improvement |
|---|---|---|---|---|
| 2025 | $13,274 | $1,037,000 | $446,000 | $591,000 |
| 2024 | $12,709 | $992,100 | $424,800 | $567,300 |
| 2023 | $11,140 | $779,000 | $353,900 | $425,100 |
| 2022 | $9,206 | $620,750 | $312,850 | $307,900 |
| 2021 | $9,085 | $614,650 | $298,050 | $316,600 |
| 2020 | $8,515 | $586,850 | $298,050 | $288,800 |
| 2019 | $8,275 | $564,850 | $283,850 | $281,000 |
| 2018 | $7,834 | $519,150 | $283,850 | $235,300 |
| 2017 | $7,595 | $521,250 | $283,850 | $237,400 |
| 2016 | $7,480 | $510,200 | $283,850 | $226,350 |
| 2015 | $7,221 | $473,850 | $283,850 | $190,000 |
Source: Public Records
Map
Nearby Homes
- 60 Warwick Dr
- 207 Hartford St
- 4 Shoestring Ln
- 197 Hartford St
- 36 Kingswood Rd
- 49 Fisher St
- 39 Bayley St
- 140 Burgess Ave
- 95 Arcadia Rd
- 132 Thatcher St
- 14 Ruel Dr
- 20 Longmeadow Dr
- 151 Arcadia Rd
- 90 Blueberry Ln
- 49 Powisset St
- 401 Sandy Valley Rd
- 11 Stonegate Dr
- 29 Hartford St
- 26 Longmeadow Dr
- 9 Stonegate Dr