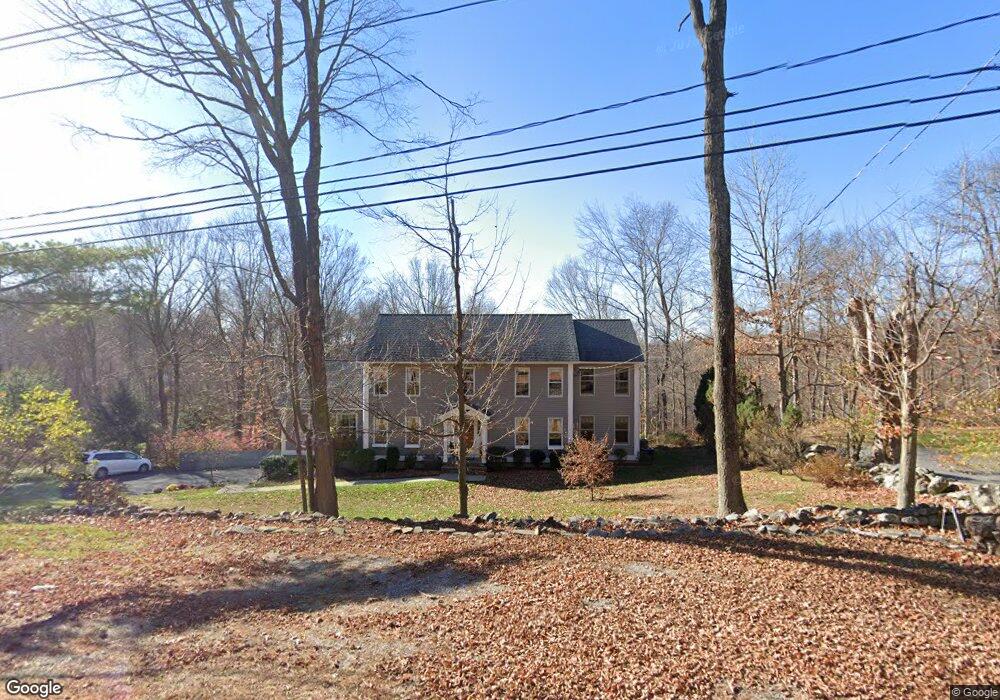
45 Warwick Rd New Fairfield, CT 06812
Estimated Value: $711,000 - $911,000
5
Beds
5
Baths
3,042
Sq Ft
$270/Sq Ft
Est. Value
About This Home
This home is located at 45 Warwick Rd, New Fairfield, CT 06812 and is currently estimated at $822,095, approximately $270 per square foot. 45 Warwick Rd is a home located in Fairfield County with nearby schools including Meeting House Hill School, New Fairfield Middle School, and New Fairfield High School.
Ownership History
Date
Name
Owned For
Owner Type
Purchase Details
Closed on
May 1, 2025
Sold by
Mannion Noel T and Mannion Samantha M
Bought by
Noel T Mannion Lt and Mannion
Current Estimated Value
Purchase Details
Closed on
Jun 8, 1996
Sold by
Wilson Rob J and Wilson Jody L
Bought by
Mannion Noel T and Mannion Samantha
Purchase Details
Closed on
Sep 8, 1989
Sold by
Westlake Thomas
Bought by
Wilson Robert J
Create a Home Valuation Report for This Property
The Home Valuation Report is an in-depth analysis detailing your home's value as well as a comparison with similar homes in the area
Home Values in the Area
Average Home Value in this Area
Purchase History
| Date | Buyer | Sale Price | Title Company |
|---|---|---|---|
| Noel T Mannion Lt | -- | None Available | |
| Noel T Mannion Lt | -- | None Available | |
| Mannion Noel T | $277,500 | -- | |
| Mannion Noel T | $277,500 | -- | |
| Wilson Robert J | $298,500 | -- |
Source: Public Records
Mortgage History
| Date | Status | Borrower | Loan Amount |
|---|---|---|---|
| Previous Owner | Wilson Robert J | $360,000 | |
| Previous Owner | Wilson Robert J | $90,000 | |
| Previous Owner | Wilson Robert J | $360,000 |
Source: Public Records
Tax History Compared to Growth
Tax History
| Year | Tax Paid | Tax Assessment Tax Assessment Total Assessment is a certain percentage of the fair market value that is determined by local assessors to be the total taxable value of land and additions on the property. | Land | Improvement |
|---|---|---|---|---|
| 2025 | $11,838 | $449,600 | $117,400 | $332,200 |
| 2024 | $11,044 | $302,400 | $111,100 | $191,300 |
| 2023 | $10,554 | $302,400 | $111,100 | $191,300 |
| 2022 | $9,819 | $302,400 | $111,100 | $191,300 |
| 2021 | $9,523 | $302,400 | $111,100 | $191,300 |
| 2020 | $9,247 | $302,400 | $111,100 | $191,300 |
| 2019 | $8,939 | $289,300 | $111,100 | $178,200 |
| 2018 | $8,847 | $289,300 | $111,100 | $178,200 |
| 2017 | $8,627 | $289,300 | $111,100 | $178,200 |
| 2016 | $8,297 | $289,300 | $111,100 | $178,200 |
| 2015 | $8,297 | $287,000 | $111,100 | $175,900 |
| 2014 | $9,011 | $345,500 | $116,200 | $229,300 |
Source: Public Records
Map
Nearby Homes